Fig. 7
Download original image
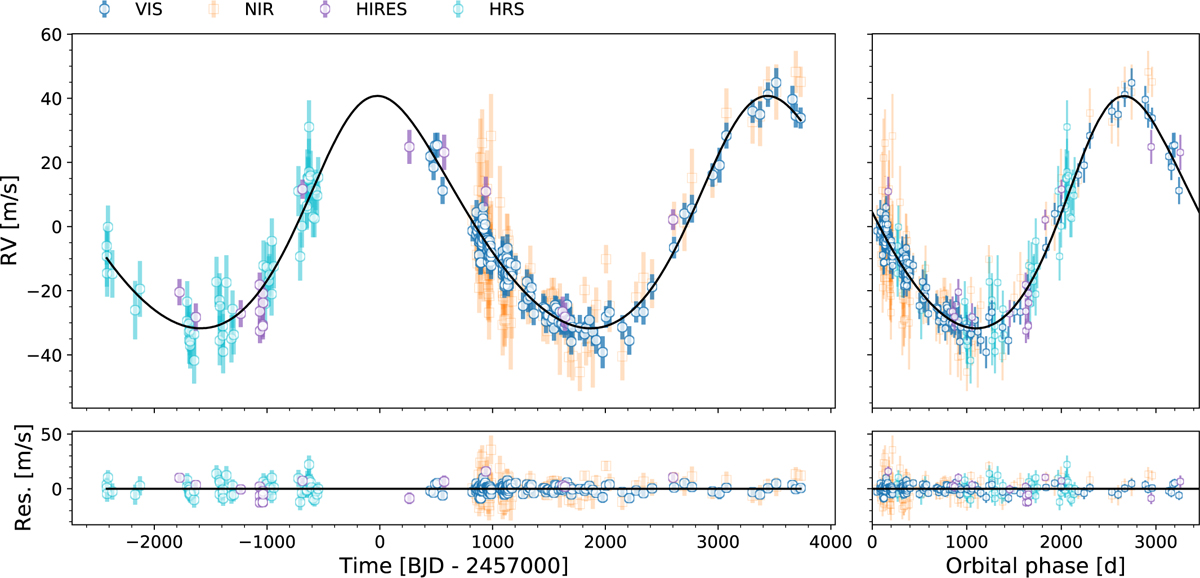
Left: RV time series of GJ 463 with the best Keplerian fit shown as solid black line. RV measurements from the CARMENES VIS and NIR channels are depicted as blue circles and orange squares, respectively, while data from HRS and HIRES are illustrated as cyan circles and purple squares, respectively. Residuals are shown in the bottom panel. Right: Phase-folded RV curve of GJ 463.
Current usage metrics show cumulative count of Article Views (full-text article views including HTML views, PDF and ePub downloads, according to the available data) and Abstracts Views on Vision4Press platform.
Data correspond to usage on the plateform after 2015. The current usage metrics is available 48-96 hours after online publication and is updated daily on week days.
Initial download of the metrics may take a while.