Fig. 1.
Download original image
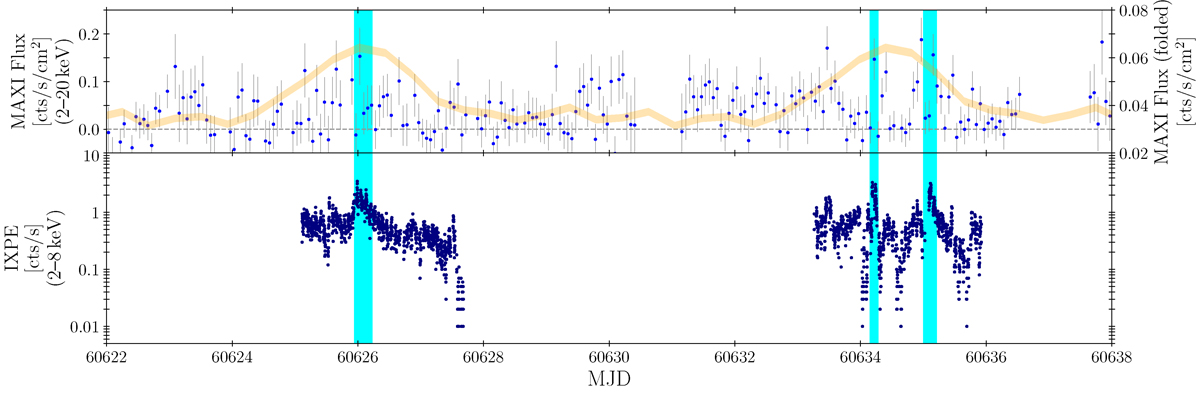
X-ray light curve of 4U 1907+09. Upper panel: Light curve in the 2–20 keV band as observed by MAXI near the IXPE observations. We also present the folded orbital light curve for MAXI data after MJD 59000 based on the ephemerides from in’t Zand et al. (1998), displayed in light orange, with its width representing flux uncertainties. Note that the folded orbital light curve uses the right-hand axis to emphasize its shape. Lower panel: Combined light curve of 4U 1907+09 from all three DUs of IXPE, with a time resolution of 100 s. The duration of the three flares observed by IXPE is indicated by cyan stripes.
Current usage metrics show cumulative count of Article Views (full-text article views including HTML views, PDF and ePub downloads, according to the available data) and Abstracts Views on Vision4Press platform.
Data correspond to usage on the plateform after 2015. The current usage metrics is available 48-96 hours after online publication and is updated daily on week days.
Initial download of the metrics may take a while.