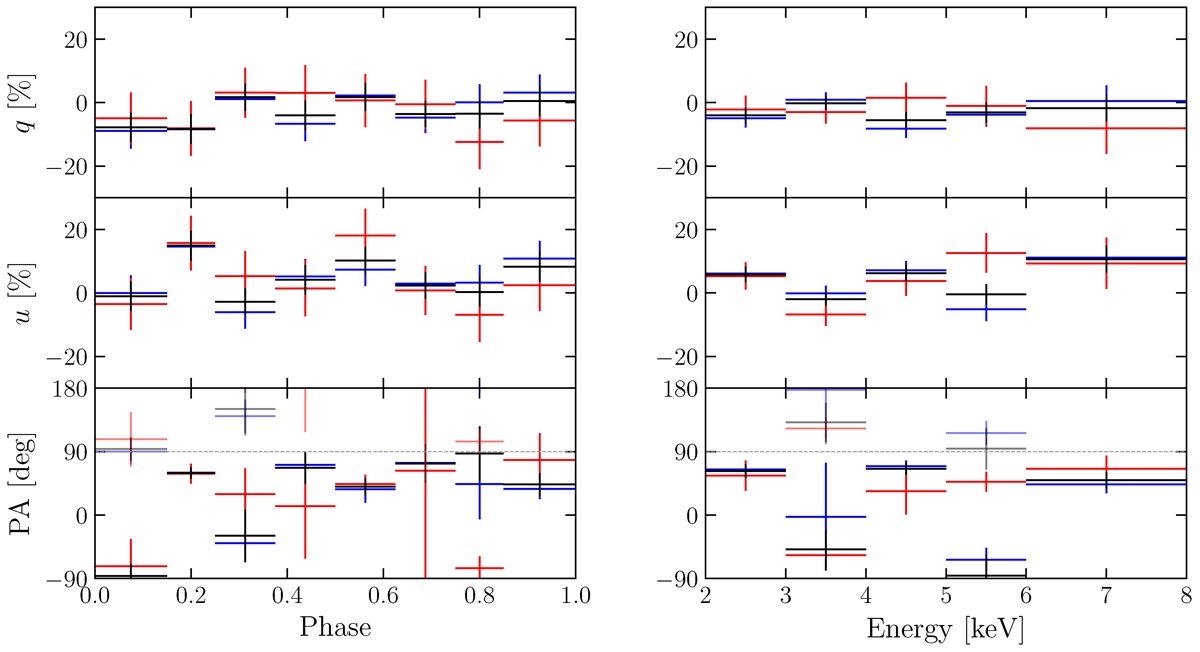
Fig. 7.
Download original image
Normalized Stokes parameters and measured PAs as functions of pulse phase and energy from the combined IXPE observation. Blue, red, and black crosses represent the flares-excluded data, flare-only data, and total emission data, respectively. Some PAs are plotted twice with an added constant of 180° to illustrate the continuity of the PA with respect to phase and energy.
Current usage metrics show cumulative count of Article Views (full-text article views including HTML views, PDF and ePub downloads, according to the available data) and Abstracts Views on Vision4Press platform.
Data correspond to usage on the plateform after 2015. The current usage metrics is available 48-96 hours after online publication and is updated daily on week days.
Initial download of the metrics may take a while.