Fig. 1
Download original image
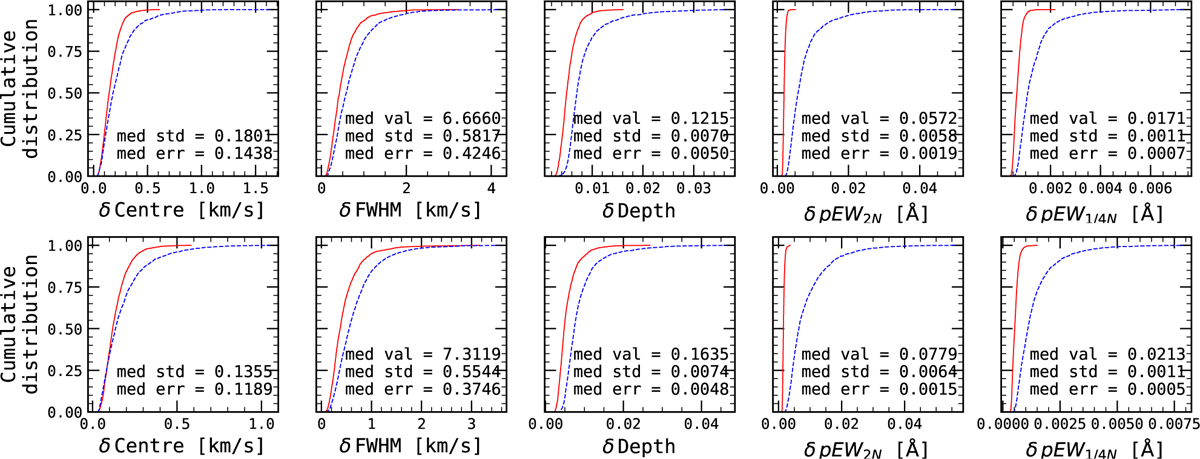
Cumulative distributions of the median uncertainties and standard deviation for extracted fit parameters and pEW for Gl 581 (top panels) and Proxima (bottom panels). The red lines are the distribution of uncertainties and the blue lines the distribution of standard deviations. The median value, standard deviation, and error are marked for each parameter.
Current usage metrics show cumulative count of Article Views (full-text article views including HTML views, PDF and ePub downloads, according to the available data) and Abstracts Views on Vision4Press platform.
Data correspond to usage on the plateform after 2015. The current usage metrics is available 48-96 hours after online publication and is updated daily on week days.
Initial download of the metrics may take a while.