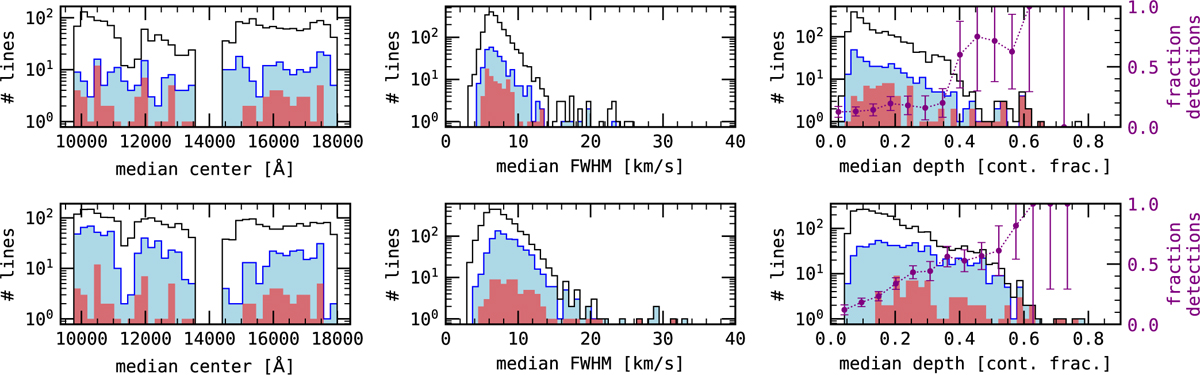
Fig. 3
Download original image
Distribution of lines with significant correlations (|ρ| ≥ 0.4, |ρ| > |ρBERV|, and p-value ≤0.01%) with activity in at least one parameter as a function of line profile parameters. The black histogram includes all the analysed lines, blue represents the lines with significant correlations between at least one parameter and one activity index, and red shows the lines with significant correlations common to both stars. The purple line indicates the fraction of lines with correlations in at least one profile parameter and at least one activity indicator to the full line list; the errorbars are given by Poisson statistics.
Current usage metrics show cumulative count of Article Views (full-text article views including HTML views, PDF and ePub downloads, according to the available data) and Abstracts Views on Vision4Press platform.
Data correspond to usage on the plateform after 2015. The current usage metrics is available 48-96 hours after online publication and is updated daily on week days.
Initial download of the metrics may take a while.