Fig. A.1
Download original image
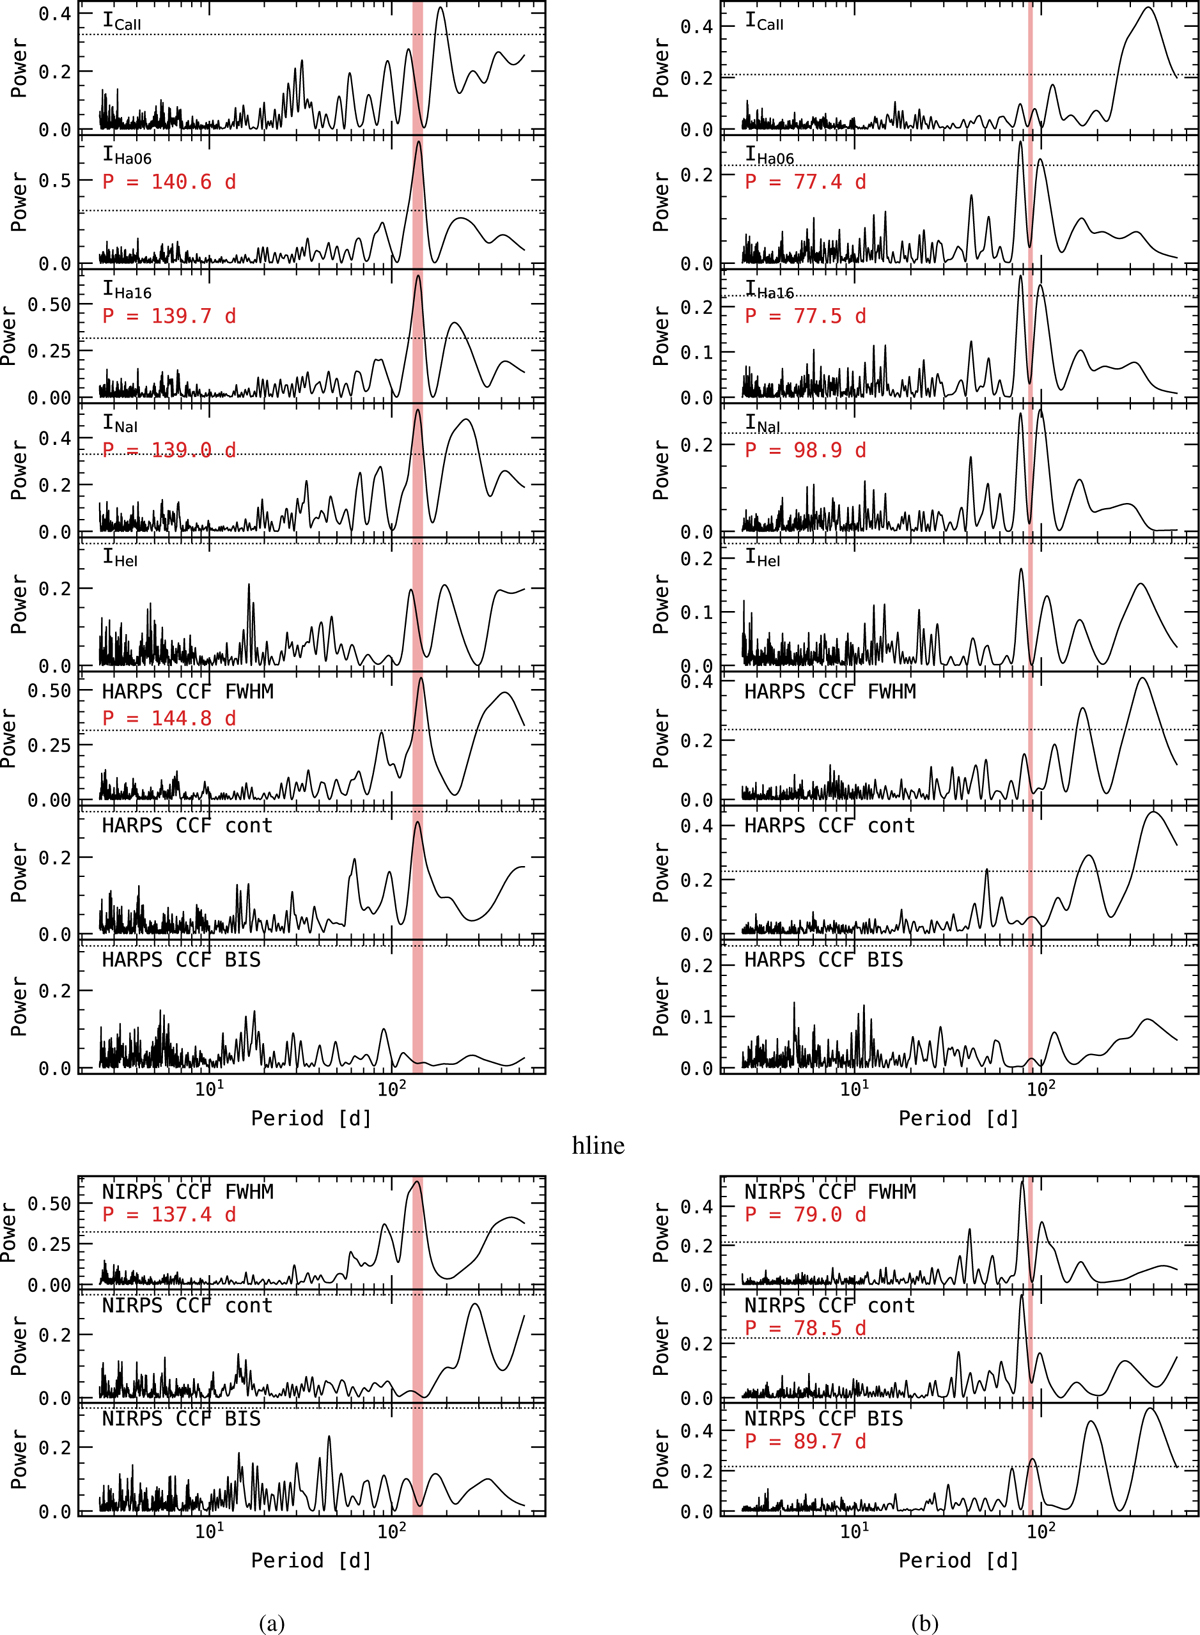
HARPS (top panels) and NIRPS (bottom panels) activity index GLS for Gl 581 (a) and Proxima (b). The vertical red band in the GLS marks the literature rotation period span between the minimum and the maximum rotation periods found in the literature. The period value in red represents the highest peak closest to the literature values. The horizontal dotted lines in GLS indicate the FAP = 0.1% level
Current usage metrics show cumulative count of Article Views (full-text article views including HTML views, PDF and ePub downloads, according to the available data) and Abstracts Views on Vision4Press platform.
Data correspond to usage on the plateform after 2015. The current usage metrics is available 48-96 hours after online publication and is updated daily on week days.
Initial download of the metrics may take a while.