Open Access
Fig. B.1
Download original image
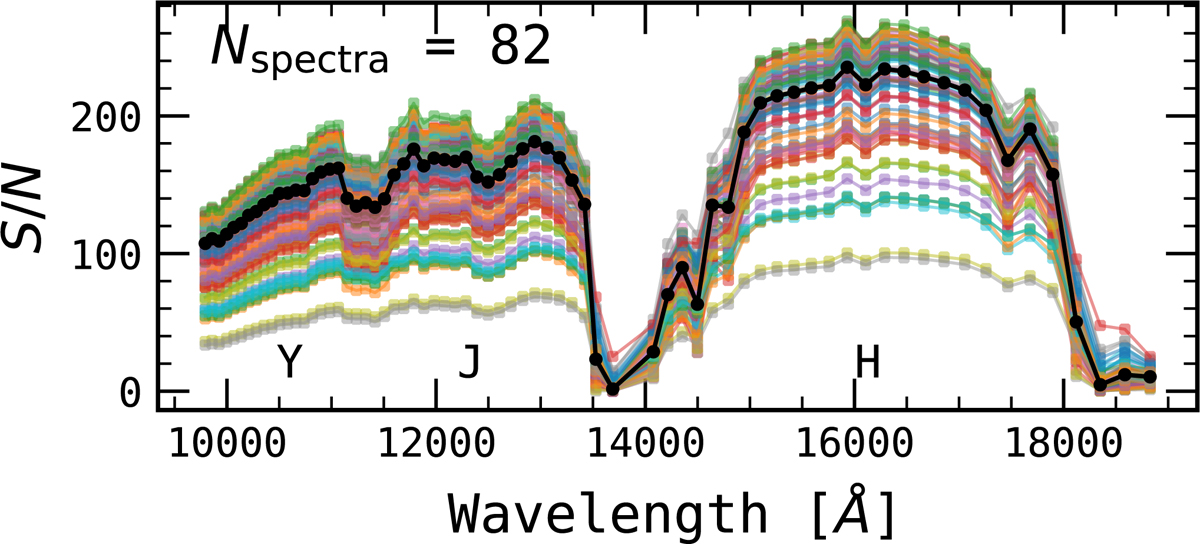
S/N per order for all NIRPS observations of Gl 581. The superposed black line represents the median S/N of all spectra per order. The approximate positions of the NIR Y, J, and H photometric bandpasses are marked above the x-axis.
Current usage metrics show cumulative count of Article Views (full-text article views including HTML views, PDF and ePub downloads, according to the available data) and Abstracts Views on Vision4Press platform.
Data correspond to usage on the plateform after 2015. The current usage metrics is available 48-96 hours after online publication and is updated daily on week days.
Initial download of the metrics may take a while.