Fig. D.1
Download original image
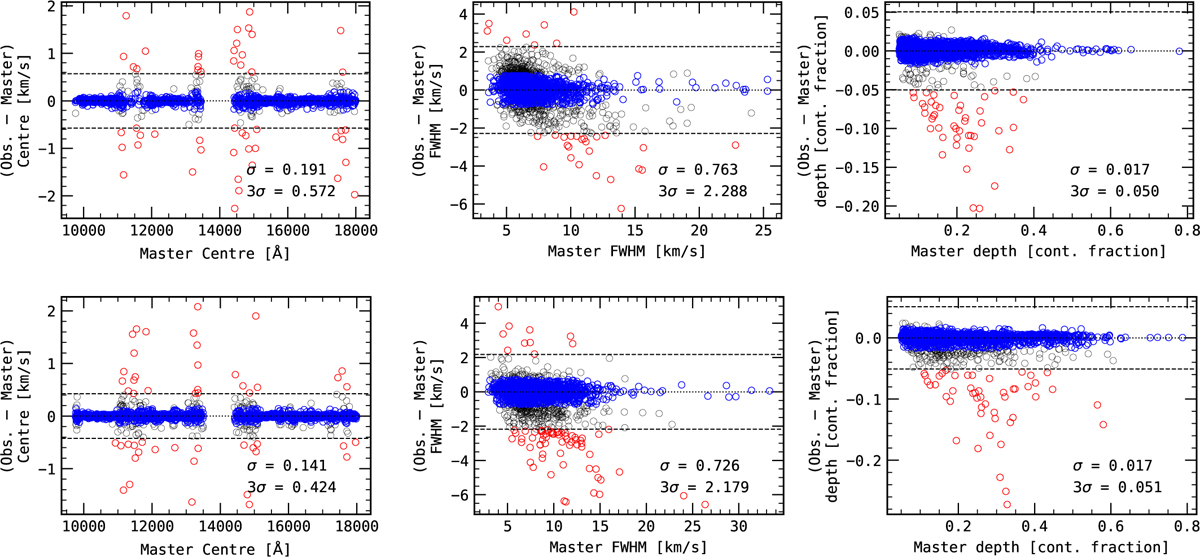
Difference between the median parameter values extracted from the fit to observations and the master spectra parameters. The horizontal lines mark the position of the 3σ levels around the median. The blue circles are lines with values below the 1σ levels; the red circles are the removed lines with values above the 3σ levels. Values of 1σ and 3σ levels are displayed for each parameter.
Current usage metrics show cumulative count of Article Views (full-text article views including HTML views, PDF and ePub downloads, according to the available data) and Abstracts Views on Vision4Press platform.
Data correspond to usage on the plateform after 2015. The current usage metrics is available 48-96 hours after online publication and is updated daily on week days.
Initial download of the metrics may take a while.