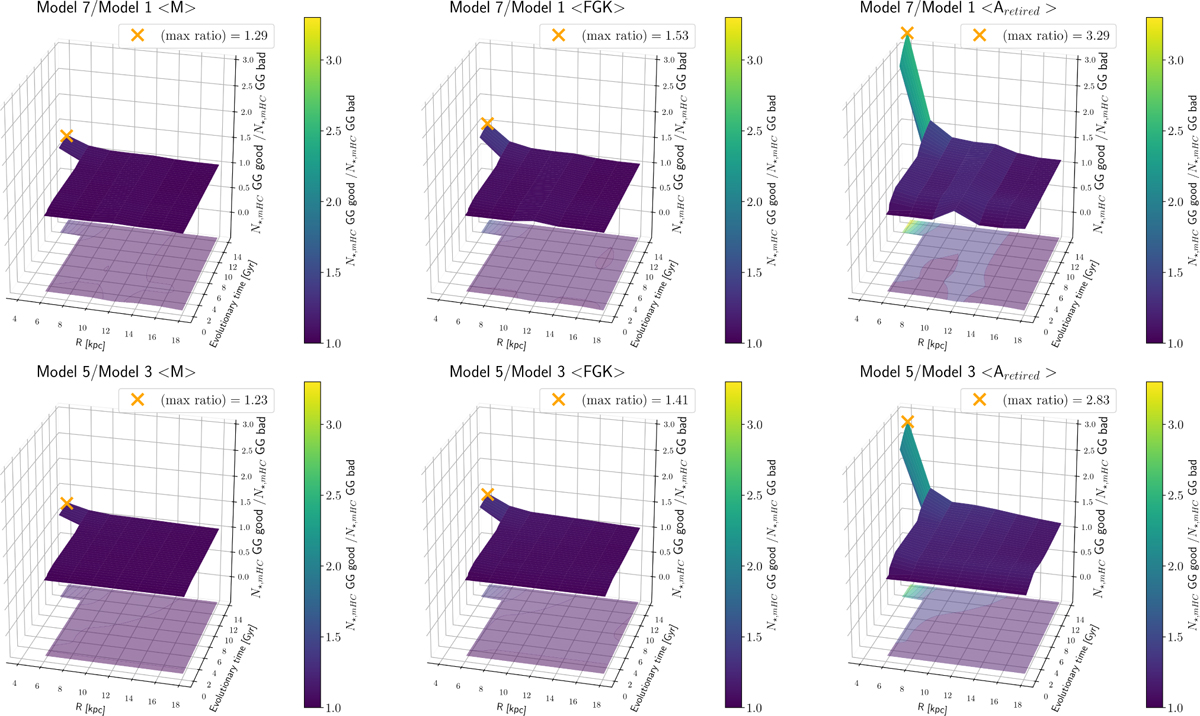
Fig. 10
Download original image
Ratios between the predicted number of stars having Earths (N★,mHC) of the two different prescriptions for PE as in Fig. 1: GG GOOD and GG BAD cases, respectively. Results for M, FGK, and retired A are reported in the left, middle, and right panels, respectively. Ratios are computed as functions of the Galactocentric distance and Galactic time and all the displayed models consider the case 2 for the SN damage. Upper panels: reference models without stellar migration (ratio between model 7 and model 1 in Table 1). Lower panels: models with stellar migration and σRM = 3.5 (ratio between model 5 and model 3 in Table 1). In each panel the maximum value of the ratio is highlighted with an orange cross.
Current usage metrics show cumulative count of Article Views (full-text article views including HTML views, PDF and ePub downloads, according to the available data) and Abstracts Views on Vision4Press platform.
Data correspond to usage on the plateform after 2015. The current usage metrics is available 48-96 hours after online publication and is updated daily on week days.
Initial download of the metrics may take a while.