Fig. 2
Download original image
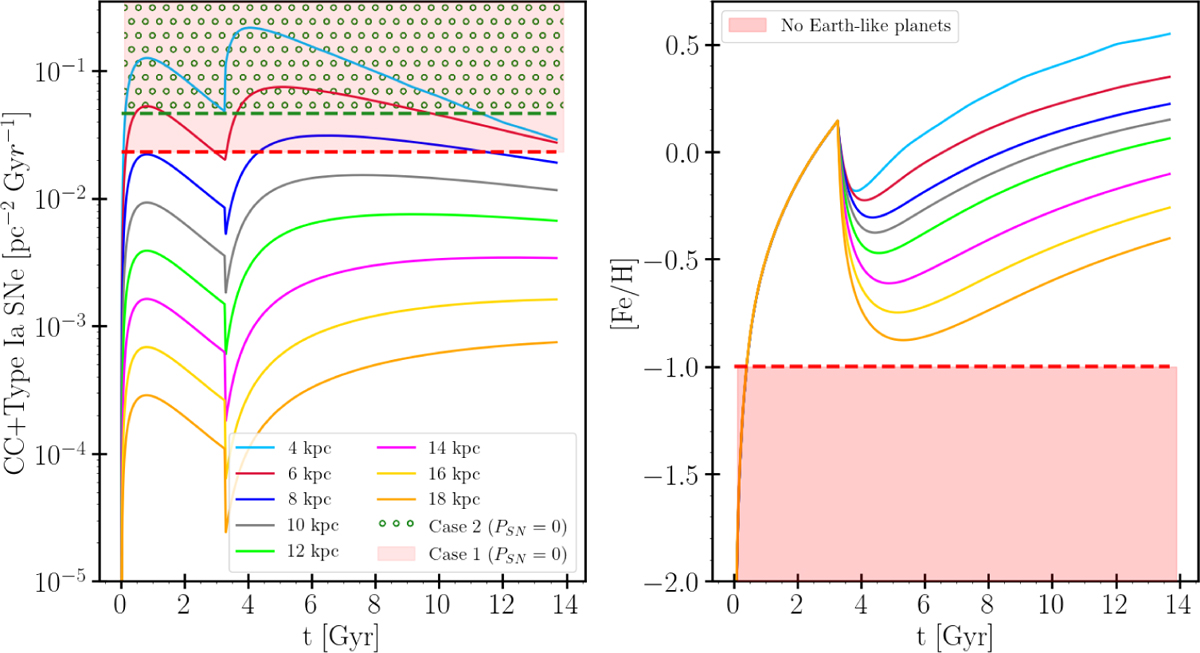
Predictions of our multi-zone chemical evolution model presented in Section 2.1 as a function of the evolutionary time t and the Galacto-centric distance. Left panel: evolution of the total (CC+Type Ia) SN rates. The red and green dashed horizontal lines indicate <RS N, ⊙> (case 1) and 2 × <RSN,⊙> (case 2) values, respectively, representing the minimum SN rate thresholds tested for SN explosion-induced destruction effects in this study. Right panel : predicted age-metallicity relation. The red-shaded region marks [Fe/H] < -1 dex where, as suggested by Johnson & Li (2012), conditions are considered unfavourable for the formation of terrestrial planets.
Current usage metrics show cumulative count of Article Views (full-text article views including HTML views, PDF and ePub downloads, according to the available data) and Abstracts Views on Vision4Press platform.
Data correspond to usage on the plateform after 2015. The current usage metrics is available 48-96 hours after online publication and is updated daily on week days.
Initial download of the metrics may take a while.