Fig. 3.
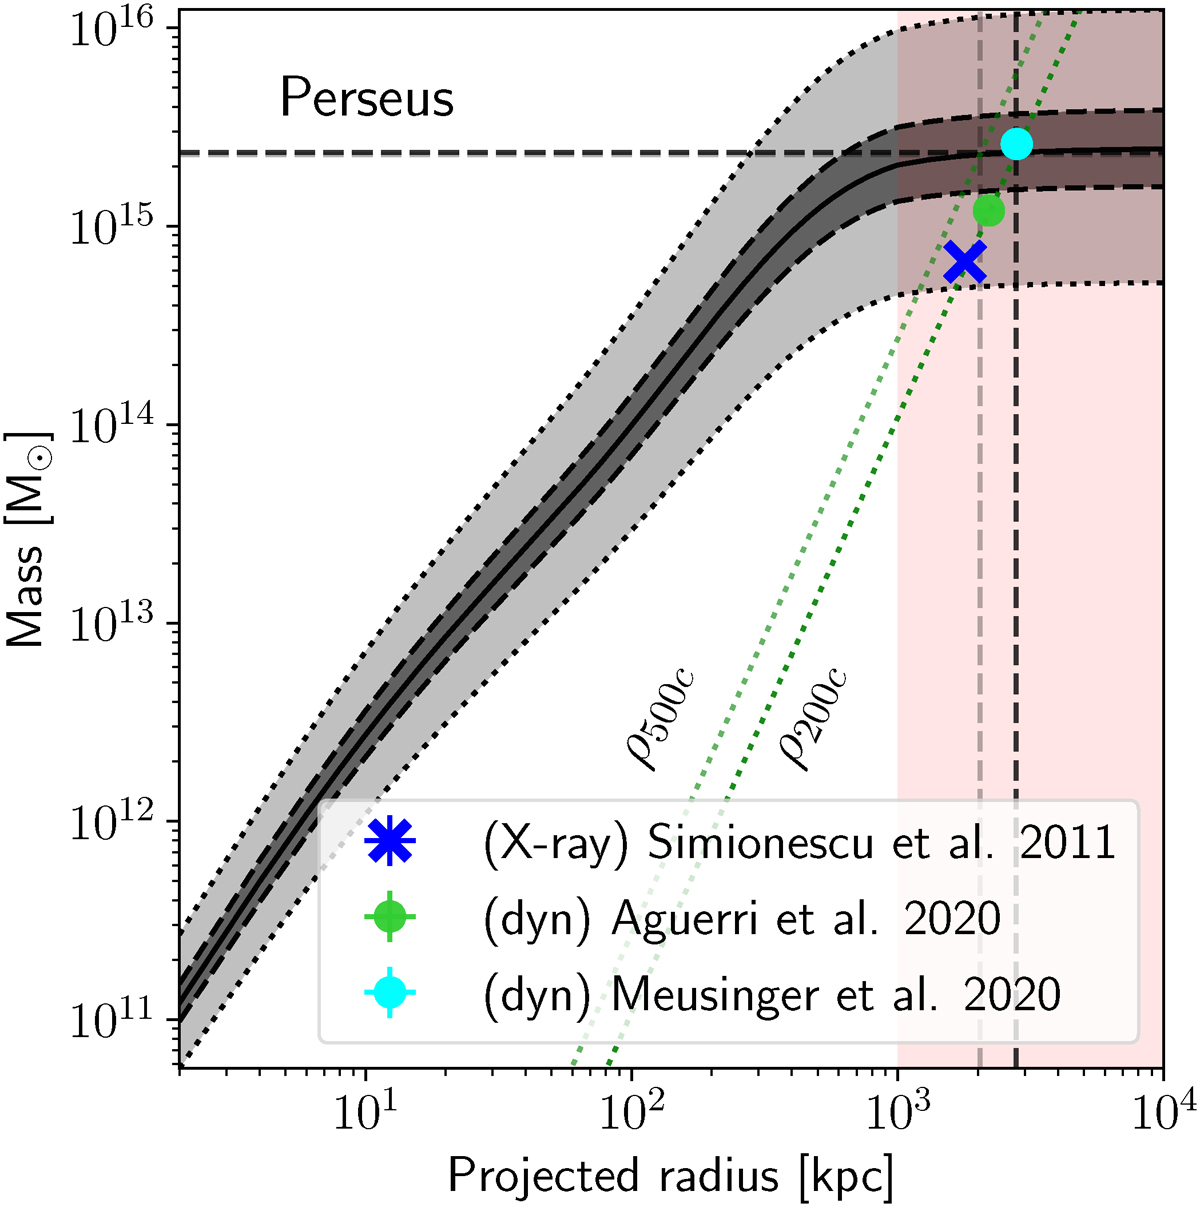
Download original image
Mass profile of the Perseus clusters as extracted from its ICL observed by Euclid (Kluge et al. 2025). The shaded regions represent the 1 and 2σ intervals. The dashed black horizontal (vertical) lines indicate the recovered M200c (R200c). The gray lines denote the same, but for M500c. The red shaded regions indicate where Σ⋆ has been extrapolated. For reference, the locus where ρ = ρ200c is shown as dotted green lines.
Current usage metrics show cumulative count of Article Views (full-text article views including HTML views, PDF and ePub downloads, according to the available data) and Abstracts Views on Vision4Press platform.
Data correspond to usage on the plateform after 2015. The current usage metrics is available 48-96 hours after online publication and is updated daily on week days.
Initial download of the metrics may take a while.