Fig. 1
Download original image
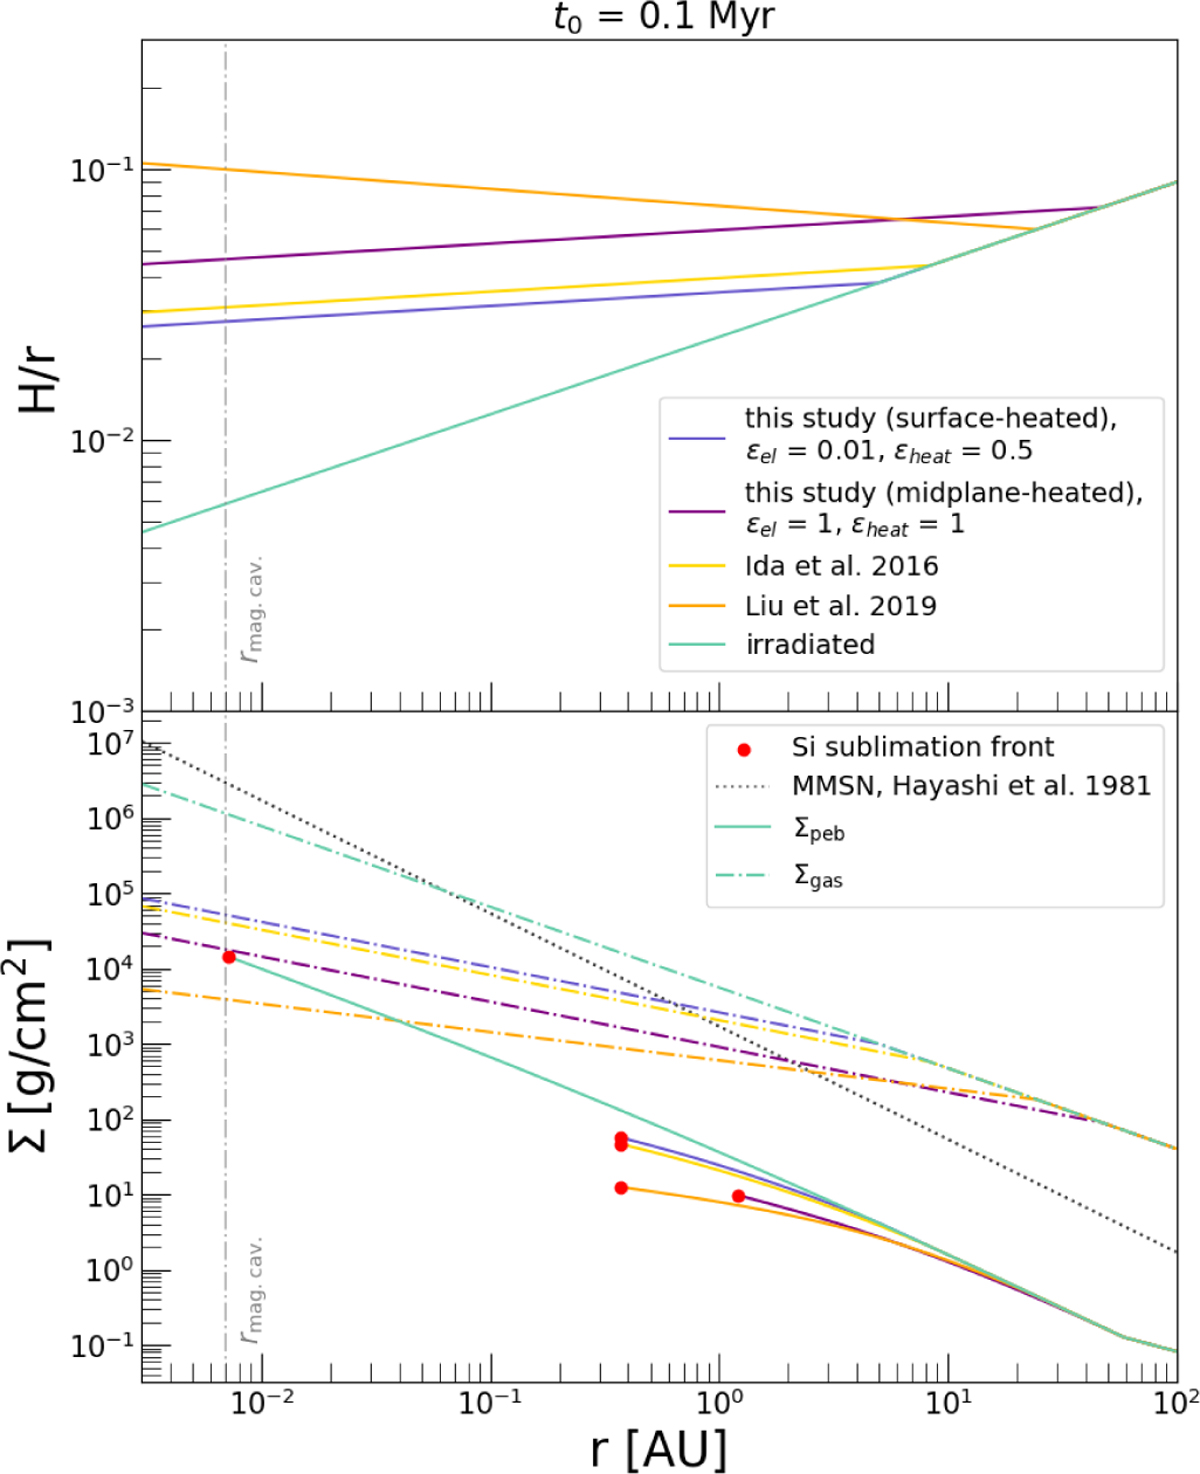
Disc gas scale height aspect ratio (upper panel) and surface density of gas and dust (lower panel, solid and dash-dotted lines, respectively) for different disc models, at initial time t0 = 0.1 Myr (Section 2.1). The green line shows a purely irradiated disc. Purple and blue curves show discs, respectively, with midplane or surface accretion heating. We plot, for comparison, in yellow and orange the viscous disc models in Ida et al. (2016) and Liu et al. (2019). We mark with a vertical dash-dotted grey line the position of the magnetospheric cavity at the initial time (Eq. (6)). In the lower panel, the dotted grey line shows the gas surface density of the minimum mass solar nebula for reference (Hayashi 1981), while red dots mark the silicate sublimation line (Eq. (20)).
Current usage metrics show cumulative count of Article Views (full-text article views including HTML views, PDF and ePub downloads, according to the available data) and Abstracts Views on Vision4Press platform.
Data correspond to usage on the plateform after 2015. The current usage metrics is available 48-96 hours after online publication and is updated daily on week days.
Initial download of the metrics may take a while.