Fig. 2
Download original image
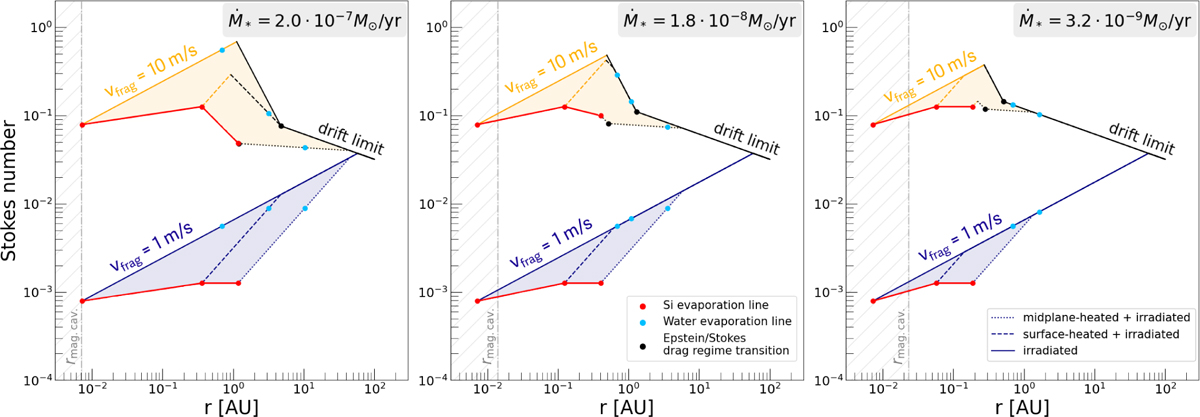
Stokes number of pebbles as a function of position, for different gas accretion rates in the different panels, corresponding to t ≃ 0.1 Myr (left), t ≃ 1.0 Myr (central), and t ≃ 5.0 Myr (right). The blue branch shows the Stokes number for vfrag = 1 m/s, while the orange branch for vfrag = 10 m/s. The black line marks where the Stokes number is limited by drift rather than fragmentation. The different line styles represent the three different disc models that we used: purely irradiated disc (mod:irrad, solid line), moderately viscously heated inner disc (mod:surfheat, dashed line) and efficiently viscously heated inner disc (mod:midheat, dotted line). In each panel, the light blue dots mark the water evaporation front, while the red dots, with corresponding connecting lines, mark the location of the Si evaporation front. The black dots represent the location at which particles enter the Stokes drag regime. Finally, the dash-dotted grey line represents the location of the inner magnetospheric cavity given by Eq. (6), which we consider to be the inner disc edge. Low fragmentation velocities near 1 m/s, and increased levels of viscous heating in young discs, reduce Stokes numbers in the inner disc.
Current usage metrics show cumulative count of Article Views (full-text article views including HTML views, PDF and ePub downloads, according to the available data) and Abstracts Views on Vision4Press platform.
Data correspond to usage on the plateform after 2015. The current usage metrics is available 48-96 hours after online publication and is updated daily on week days.
Initial download of the metrics may take a while.