Fig. 11.
Download original image
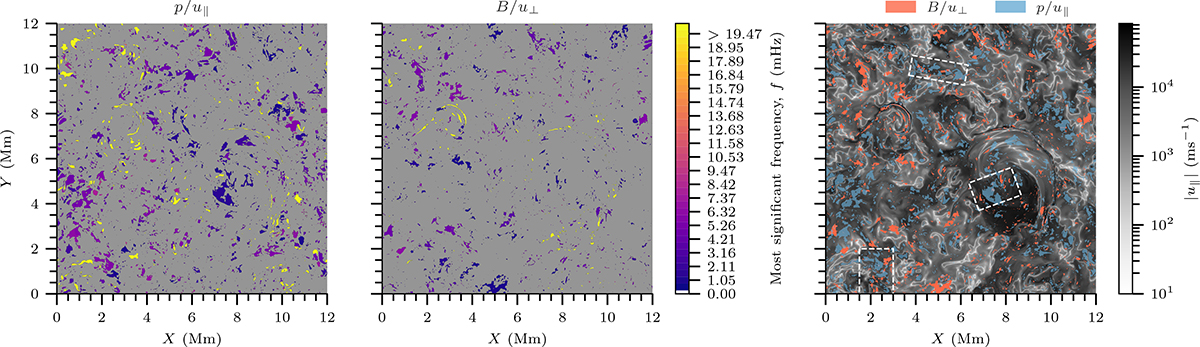
Regions of matched MSFs between the gas pressure and parallel velocity (left) and the magnitude of the magnetic field and perpendicular velocity (middle) at z = 4 Mm. The frequencies are considered matched if they are within ± ∼ 0.53 mHz (1 frequency step) of each other. The right panel shows the results from the left two panels overlaid to show overlapping regions. ‘Magnetic’ fluctuations are shown in red, whilst ‘acoustic’ fluctuations are in blue. Here, the magnitude of the frequencies is omitted. The magnitude of parallel velocity is shown for reference in the background. For all plots, MSF’s of 0 mHz have been removed as a trivial result.
Current usage metrics show cumulative count of Article Views (full-text article views including HTML views, PDF and ePub downloads, according to the available data) and Abstracts Views on Vision4Press platform.
Data correspond to usage on the plateform after 2015. The current usage metrics is available 48-96 hours after online publication and is updated daily on week days.
Initial download of the metrics may take a while.