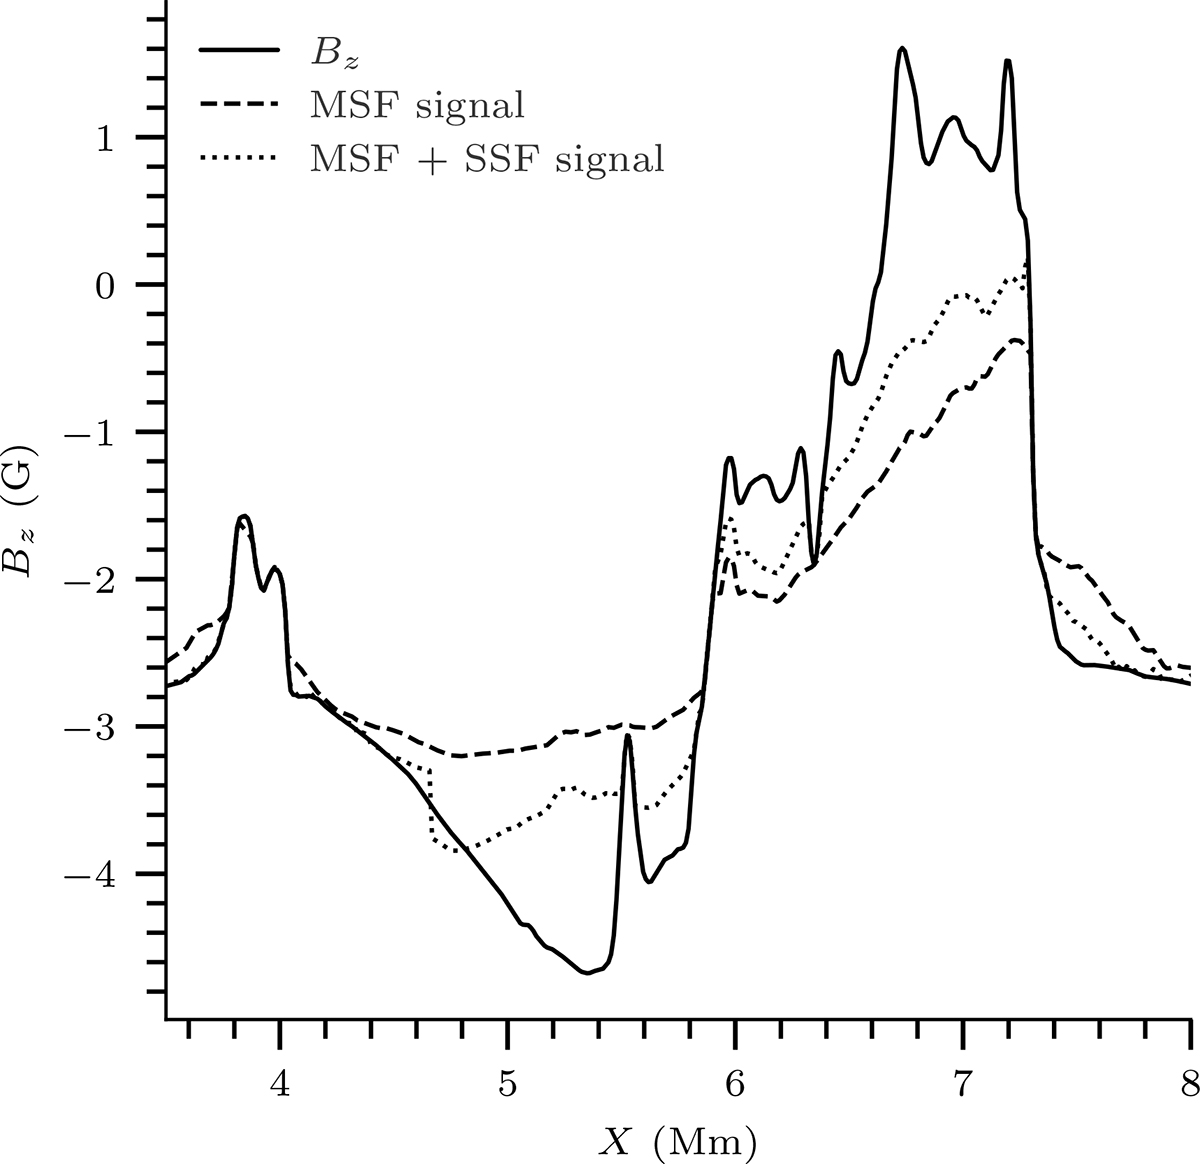
Fig. 14.
Download original image
Same 1D slice as in Figure 12, at X ≈ 8.20 Mm, for the vertical magnetic field, Bz, across the largest swirl. The signal created from the MSFs is shown by the dashed line, whilst the signal created when the SSFs are added is represented by the dotted line. The oscillations along the peak from X ≈ 6 Mm to X ≈ 7.5 Mm are not captured by either signal.
Current usage metrics show cumulative count of Article Views (full-text article views including HTML views, PDF and ePub downloads, according to the available data) and Abstracts Views on Vision4Press platform.
Data correspond to usage on the plateform after 2015. The current usage metrics is available 48-96 hours after online publication and is updated daily on week days.
Initial download of the metrics may take a while.