Fig. 4.
Download original image
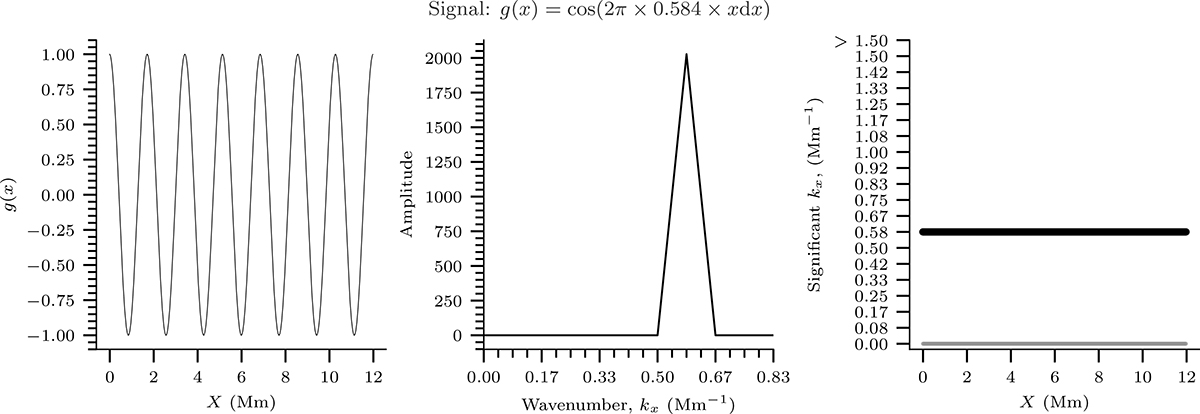
‘Proof of concept’ with an isolated signal in the xy plane, with wavenumber kx = 0.58 Mm−1, and no frequency. The first panel shows a 1D slice in the y axis, taken at an arbitrary time. The middle panel shows the amplitude spectrum from the DFT, averaged across the y and time axes, where there is a sharp peak at the 0.58 Mm−1, whilst the third panel shows the most significant signal per pixel in the domain. In grey, the MSF, ω, is shown, and is zero as expected.
Current usage metrics show cumulative count of Article Views (full-text article views including HTML views, PDF and ePub downloads, according to the available data) and Abstracts Views on Vision4Press platform.
Data correspond to usage on the plateform after 2015. The current usage metrics is available 48-96 hours after online publication and is updated daily on week days.
Initial download of the metrics may take a while.