Fig. 5.
Download original image
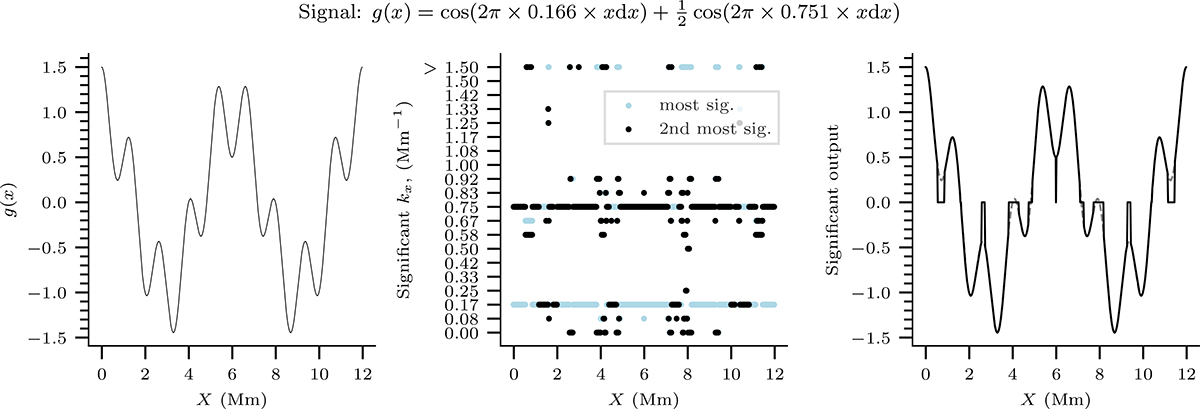
Composite signal of two frequencies, kx = 0.166 Mm−1 and kx = 0.751 Mm−1. The first panel shows the original signal, the second panel shows the results of the most and second most significant calculations, and the final panel shows the final output of the significant frequencies. The original frequency is shown by the dotted lines for reference.
Current usage metrics show cumulative count of Article Views (full-text article views including HTML views, PDF and ePub downloads, according to the available data) and Abstracts Views on Vision4Press platform.
Data correspond to usage on the plateform after 2015. The current usage metrics is available 48-96 hours after online publication and is updated daily on week days.
Initial download of the metrics may take a while.