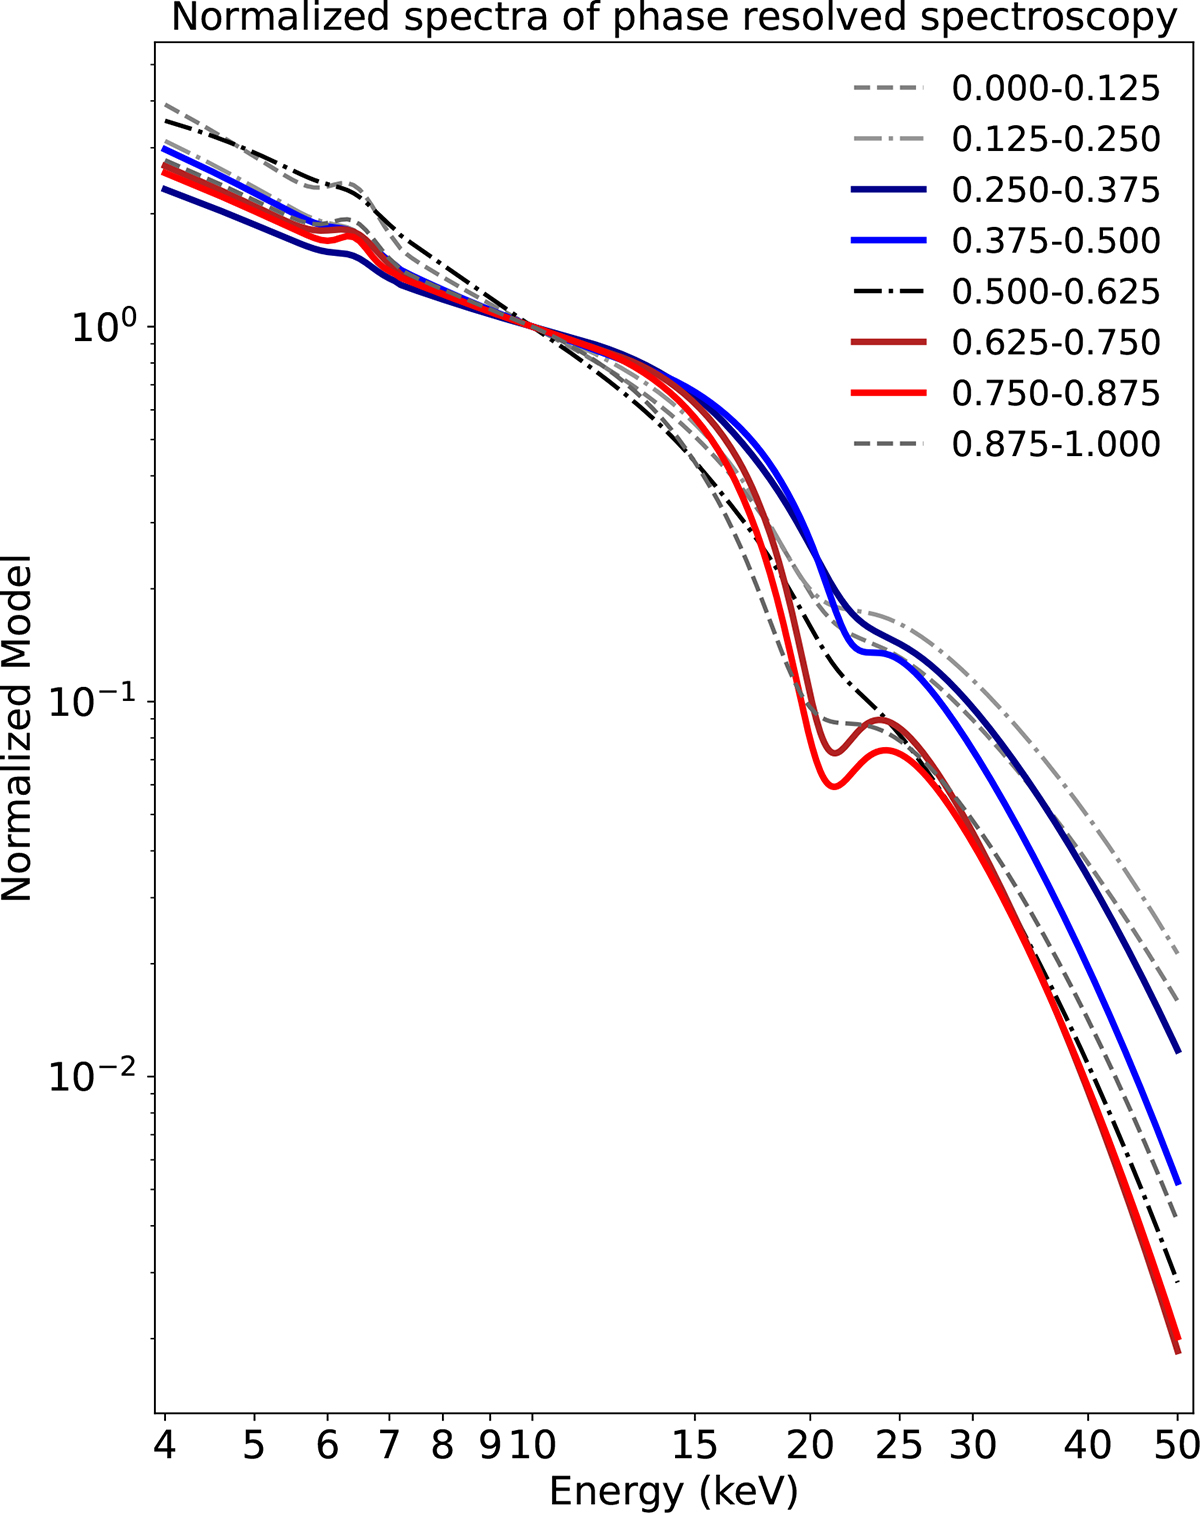
Fig. 10.
Download original image
Phase-dependent spectral variability for ObsID 304: each curve represents one of the best-fitting model from the eight phase-selected spectra. Models are normalized to unity at the reference energy of 10 keV. The blue and red curves correspond to spectra extracted in the phase intervals of the primary and secondary peak, respectively. The black spectrum shows a very shallow cyclotron line in the primary falling flank. The gray spectra correspond to the primary rising flank and secondary falling flank.
Current usage metrics show cumulative count of Article Views (full-text article views including HTML views, PDF and ePub downloads, according to the available data) and Abstracts Views on Vision4Press platform.
Data correspond to usage on the plateform after 2015. The current usage metrics is available 48-96 hours after online publication and is updated daily on week days.
Initial download of the metrics may take a while.