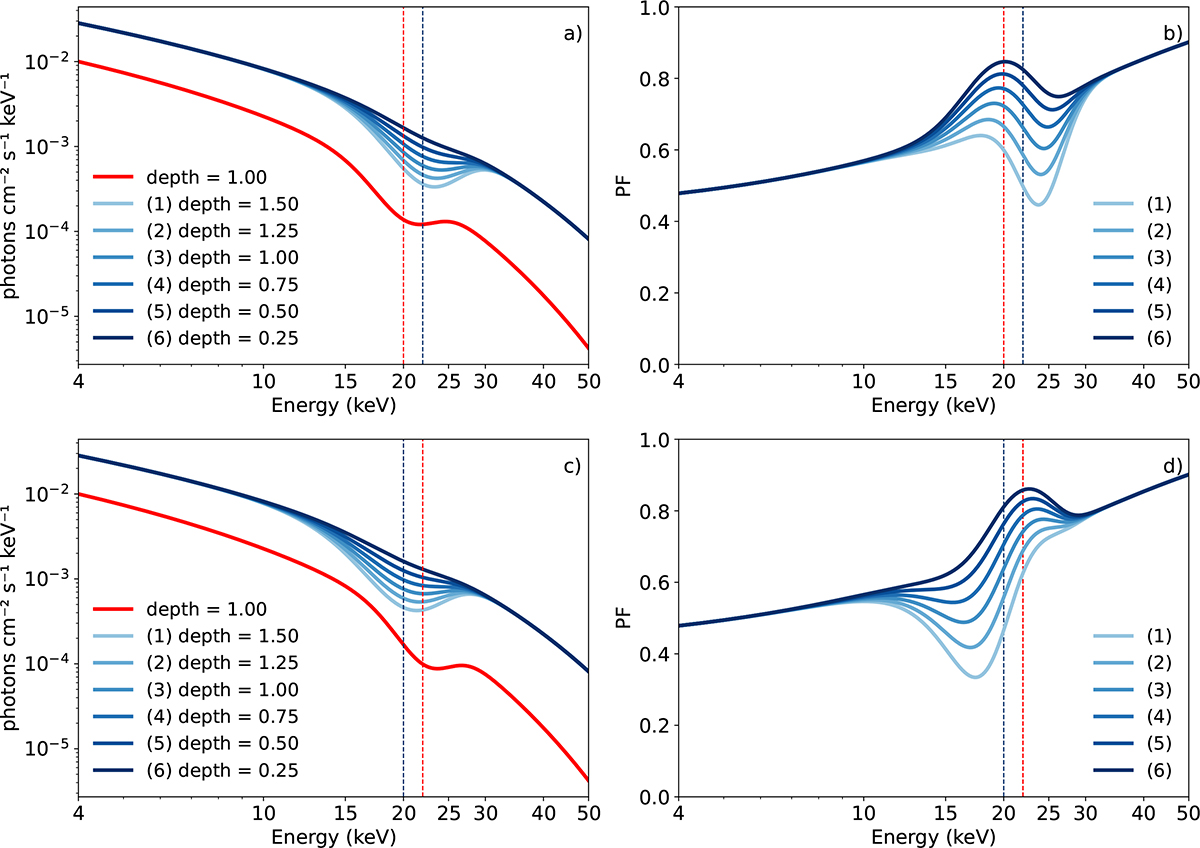
Fig. 13.
Download original image
(a) Simulated spectra for the primary and secondary peaks, modeled by a power-law continuum with an exponential energy cutoff. The cutoff energy is set at 12 keV for the primary peak spectrum (blue) and 8 keV for the secondary peak spectrum (red). The absorption line in the secondary peak spectrum is centered at 20 keV with a width of 3 keV, while the absorption line in the primary peak spectrum is at 22 keV with a width of 4 keV. (b) Simulated PFS of the spectra shown in (a) using the CV proxy. The red and blue vertical lines highlight the energies of the absorption feature in the secondary and primary peaks, at 20 and 22 keV, respectively. (c) Simulated spectra for the primary and secondary peaks, where the energies of the absorption features have been exchanged between the two. (d) Simulated PFS of the spectra shown in (c) using the CV proxy.
Current usage metrics show cumulative count of Article Views (full-text article views including HTML views, PDF and ePub downloads, according to the available data) and Abstracts Views on Vision4Press platform.
Data correspond to usage on the plateform after 2015. The current usage metrics is available 48-96 hours after online publication and is updated daily on week days.
Initial download of the metrics may take a while.