Fig. 15.
Download original image
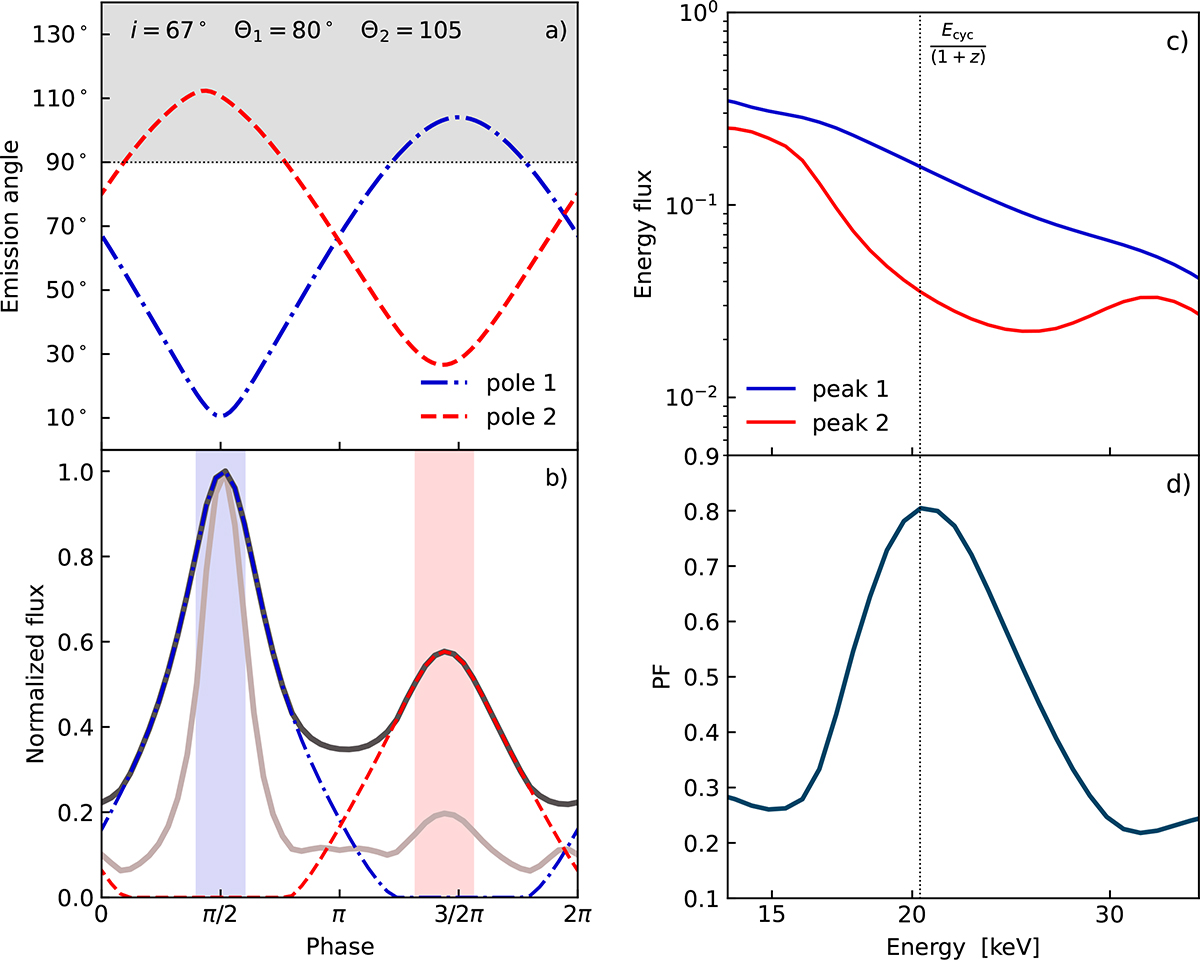
Phase-dependent emission angle and various observables modeled for a selected geometry: i = 67°, Θ1 = 80°, Θ2 = 105° and ΔΦ = 168°. The mass and radius of the NS are MNS = 1.4 M⊙ and RNS = 12 km, the size of spot-like poles is r0 = 300 m. The emission from each emitting surface element is calculated for: Ecyc = 25 keV, kTe = 6 keV, ne = 1023 cm−3 and τT = 20. (a) Emission angle, visible for a remote observer at each rotation phase. The angle is calculated for a center of a pole on the NS surface in the Schwarzschild metric (blue dashed-dotted line corresponds to pole 1, red dashed line – to pole 2). The shadowed region shows when a pole is obscured by the NS. (b) Energy-integrated (5 − 80 keV) pulsed profile (black thick line) for the same geometry, with individual pole contributions. Light-gray line shows the PP in the energy range 19 − 24 keV, corresponding to the core of the fundamental CRSF in the observer’s rest frame. (c) Modeled energy flux near the fundamental line. The blue and red lines are obtained for the central regions of the primary (“peak 1”) and secondary (“peak 2”) peaks in the PPs; the respective ranges of phases are marked by shadow regions in panel b. The black dotted line marks the redshifted value for the cyclotron energy. (d) PFS in the same energy range as in panel c.
Current usage metrics show cumulative count of Article Views (full-text article views including HTML views, PDF and ePub downloads, according to the available data) and Abstracts Views on Vision4Press platform.
Data correspond to usage on the plateform after 2015. The current usage metrics is available 48-96 hours after online publication and is updated daily on week days.
Initial download of the metrics may take a while.