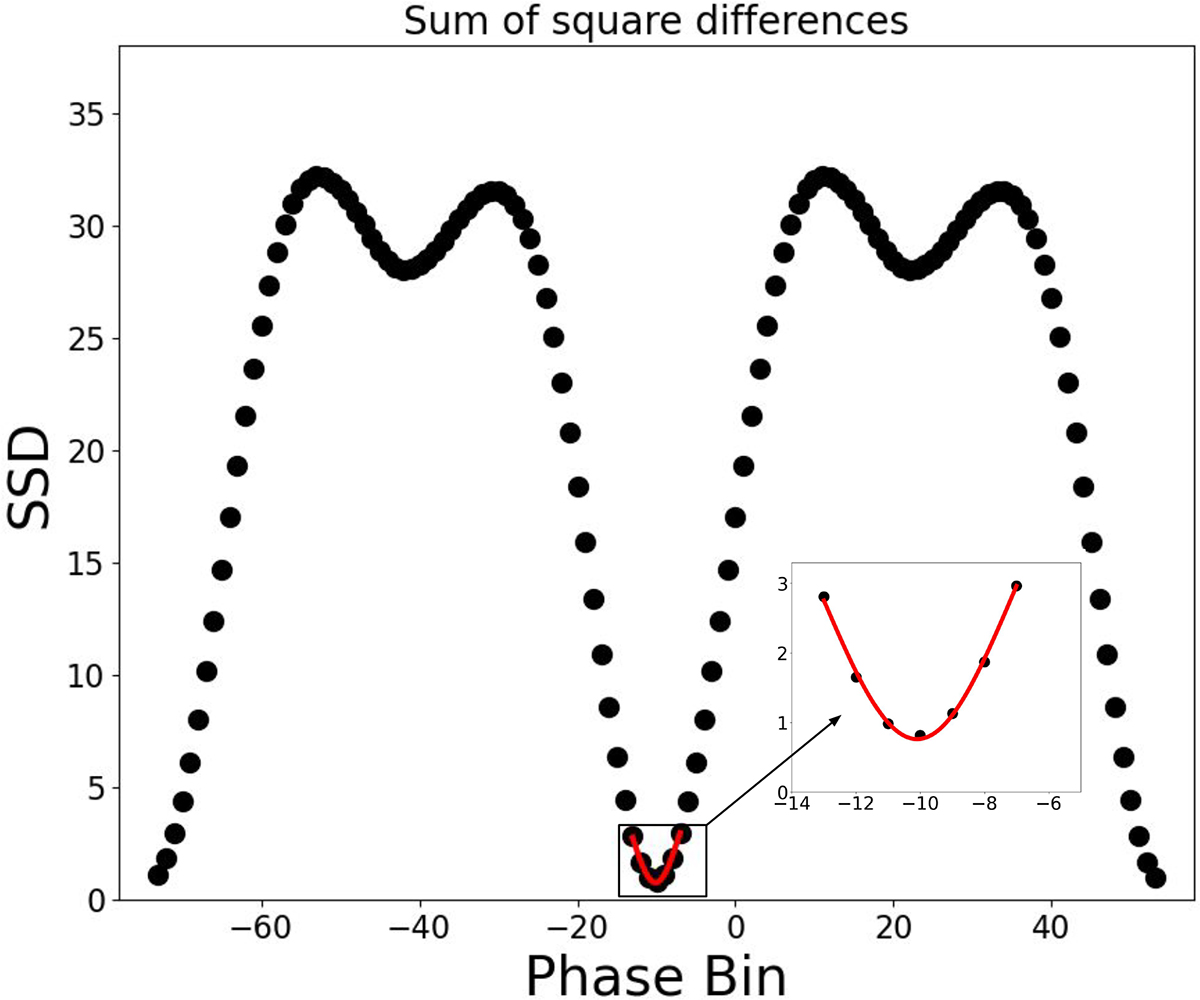
Fig. 2.
Download original image
Alignment of the energy-phase matrices. The plot shows the SSD values calculated for each phase shift between the PP of a given observation and the reference PP (ObsID 304). The minimum SSD value corresponds to the best alignment, and the points around this minimum are fitted with a Gaussian to refine the phase shift determination and account for statistical fluctuations. The centroid of the Gaussian provides the precise phase shift used for alignment.
Current usage metrics show cumulative count of Article Views (full-text article views including HTML views, PDF and ePub downloads, according to the available data) and Abstracts Views on Vision4Press platform.
Data correspond to usage on the plateform after 2015. The current usage metrics is available 48-96 hours after online publication and is updated daily on week days.
Initial download of the metrics may take a while.