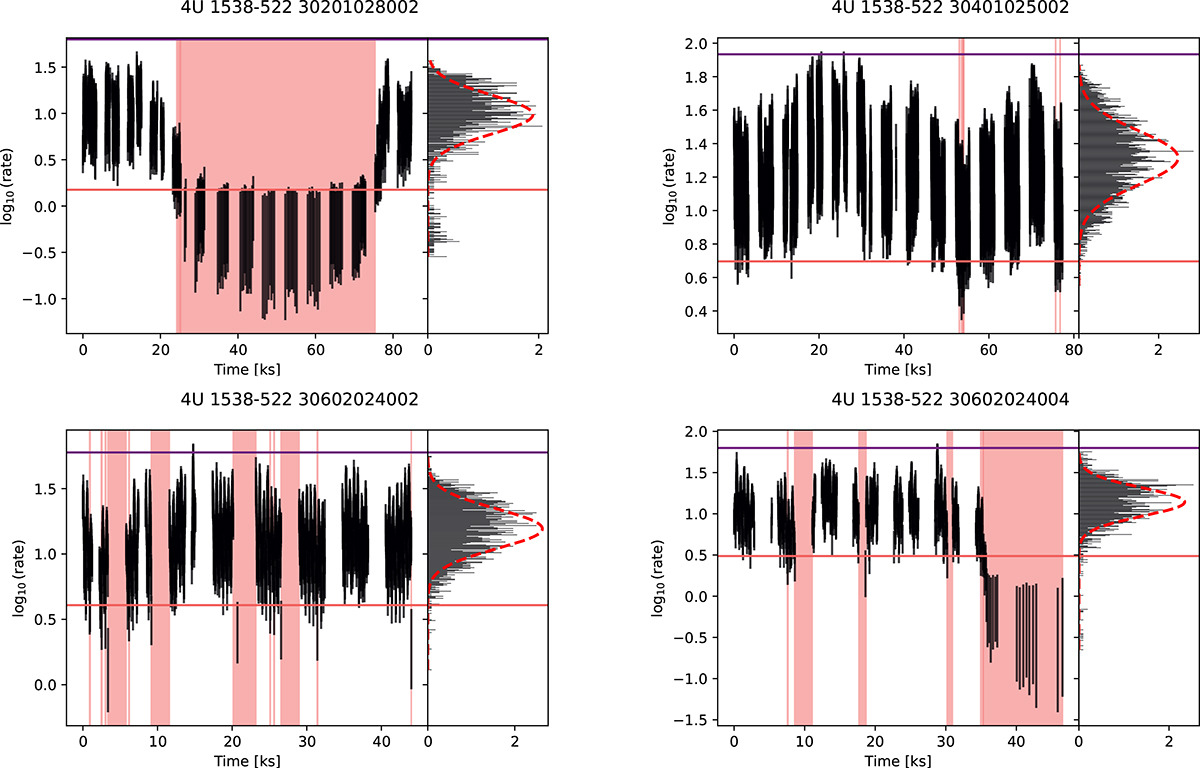
Fig. D.1.
Download original image
Filtering of light curves using a log-normal distribution of counts in the 3–70 keV band. Left panels: Total light curve of each observation. The horizontal lines mark the adopted count rate limits, while the pink vertical bands indicate time intervals that were excluded from further analysis. Right panels: Logarithmic histograms of count rates, with horizontal lines denoting the same adopted limits, where good time intervals were defined as those corresponding to count rates within the ±5σ of the central peak of the log-normal distribution.
Current usage metrics show cumulative count of Article Views (full-text article views including HTML views, PDF and ePub downloads, according to the available data) and Abstracts Views on Vision4Press platform.
Data correspond to usage on the plateform after 2015. The current usage metrics is available 48-96 hours after online publication and is updated daily on week days.
Initial download of the metrics may take a while.