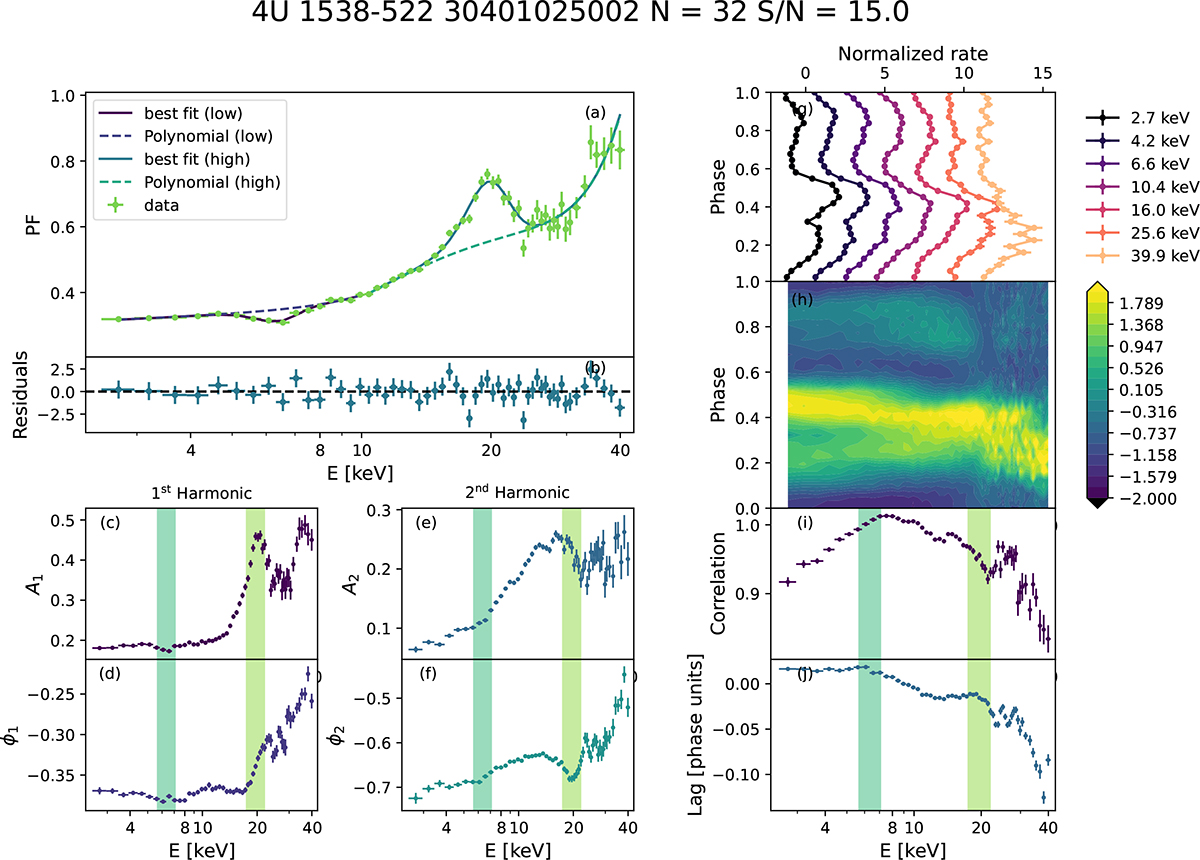
Fig. 5.
Download original image
Summary plot for ObsID 304 using 32 phase bins and a S/N 15. Panel a: PF (green points) along with its best-fit model (solid lines); polynomial fits are also included for comparison. Panel b: residuals from the fit. Panels c–f: Phases and normalized amplitudes of the first (A1, ϕ1) and second harmonic (A2, ϕ2), respectively. The vertical shaded regions denote the energy ranges and widths of the Gaussian functions fitted to the PF. Panel g: Selection of normalized PPs at equally spaced logarithmic energy intervals, horizontally offset for clarity. Each pulse in the bin was normalized by subtracting its mean and dividing by the standard deviation. Panel h: Color-map display of the normalized PPs as a function of energy, with 20 evenly spaced contour lines drawn for reference. Panel i: CC between the PP at each energy band and the overall average profile. Panel j: corresponding phase lags. The colored vertical regions are consistent with those in panels d–f.
Current usage metrics show cumulative count of Article Views (full-text article views including HTML views, PDF and ePub downloads, according to the available data) and Abstracts Views on Vision4Press platform.
Data correspond to usage on the plateform after 2015. The current usage metrics is available 48-96 hours after online publication and is updated daily on week days.
Initial download of the metrics may take a while.