Fig. B.2.
Download original image
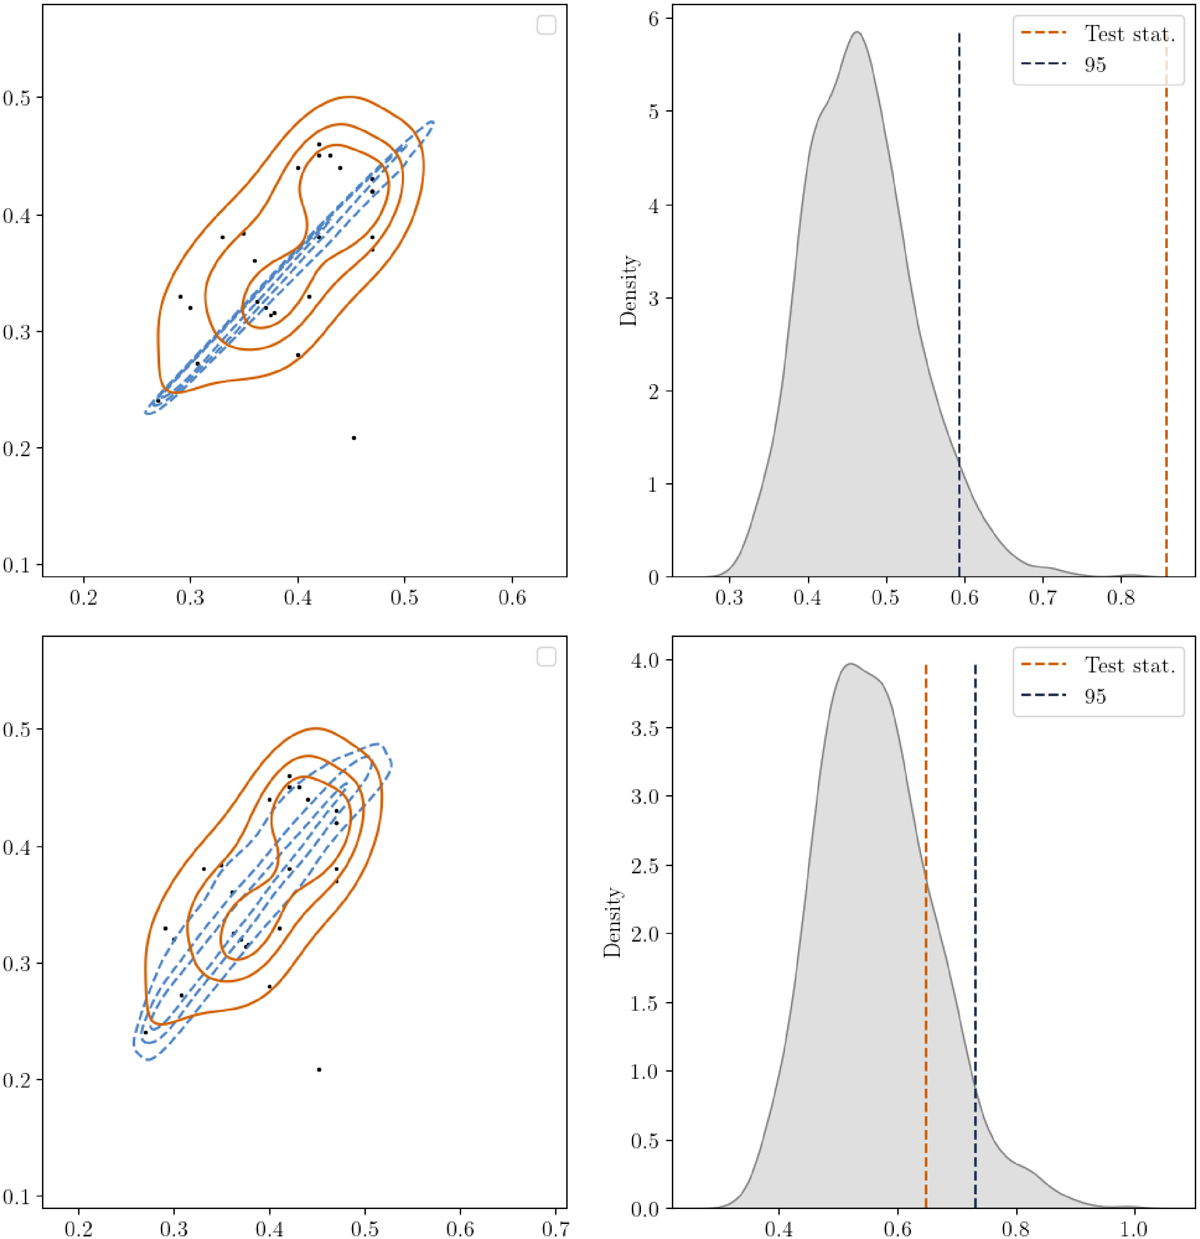
Left panels: densities determined by ConTEST for the data (orange, solid) and model (dashed, blue). Right panels: distribution of distances between simulated data sets and model. The 95% limit is shown as black dashed line, the distance of the actual observations is shown as orange dashed line. Top panels are for the model assuming the first mass transfer is stable. The model is rejected as the distance is larger than any of the simulated data sets (p-value is 0.0). Bottom for the model assuming the first phase of mass transfer is described by the γ-prescription. In this case the model is consistent, with p-value of 0.13.
Current usage metrics show cumulative count of Article Views (full-text article views including HTML views, PDF and ePub downloads, according to the available data) and Abstracts Views on Vision4Press platform.
Data correspond to usage on the plateform after 2015. The current usage metrics is available 48-96 hours after online publication and is updated daily on week days.
Initial download of the metrics may take a while.