Fig. 2.
Download original image
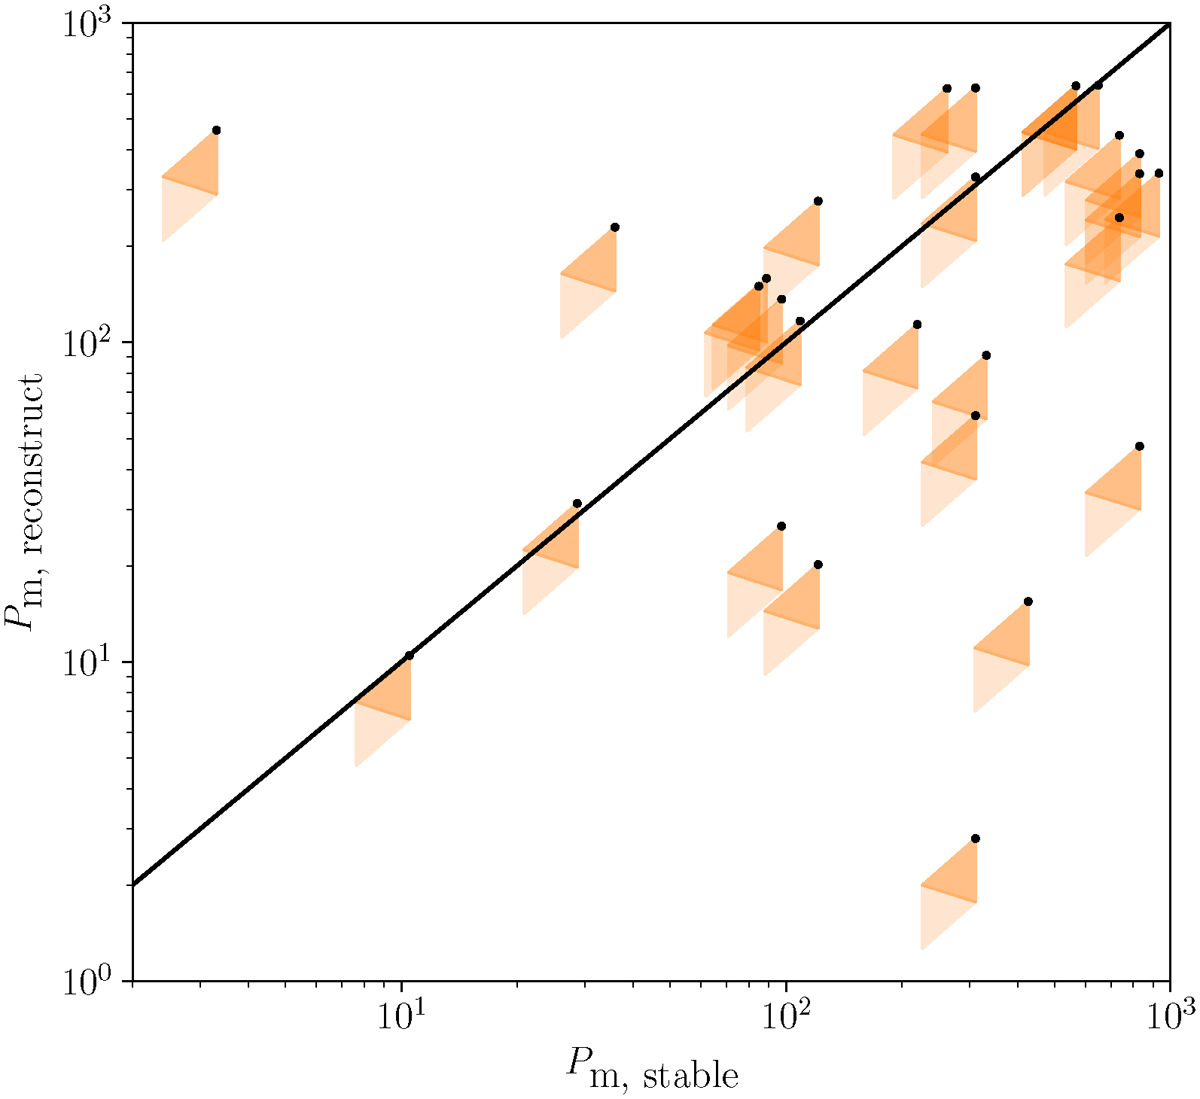
Reconstructed intermediate period based on reconstructing the second phase of mass transfer (y-axis) versus expected intermediate period based on the assumption that the first phase of mass transfer was stable (x-axis). The diamond shapes indicate the possible values for the observed systems for different assumptions. Lowering the metallicity lowers both periods, while increasing M2 lowers only the values on the y-axis. Top right of each diamond thus is for solar metallicity and M2 = 1 M⊙ and bottom left is for intermediate metallicity and M2 = 2 M⊙. The shading indicates that, very broadly, the upper parts are more likely scenarios (see text). If all systems were formed through stable mass transfer, all shapes should intersect with the diagonal. Systems 1, 16, and 17 have identical masses and thus fall on top of each other.
Current usage metrics show cumulative count of Article Views (full-text article views including HTML views, PDF and ePub downloads, according to the available data) and Abstracts Views on Vision4Press platform.
Data correspond to usage on the plateform after 2015. The current usage metrics is available 48-96 hours after online publication and is updated daily on week days.
Initial download of the metrics may take a while.