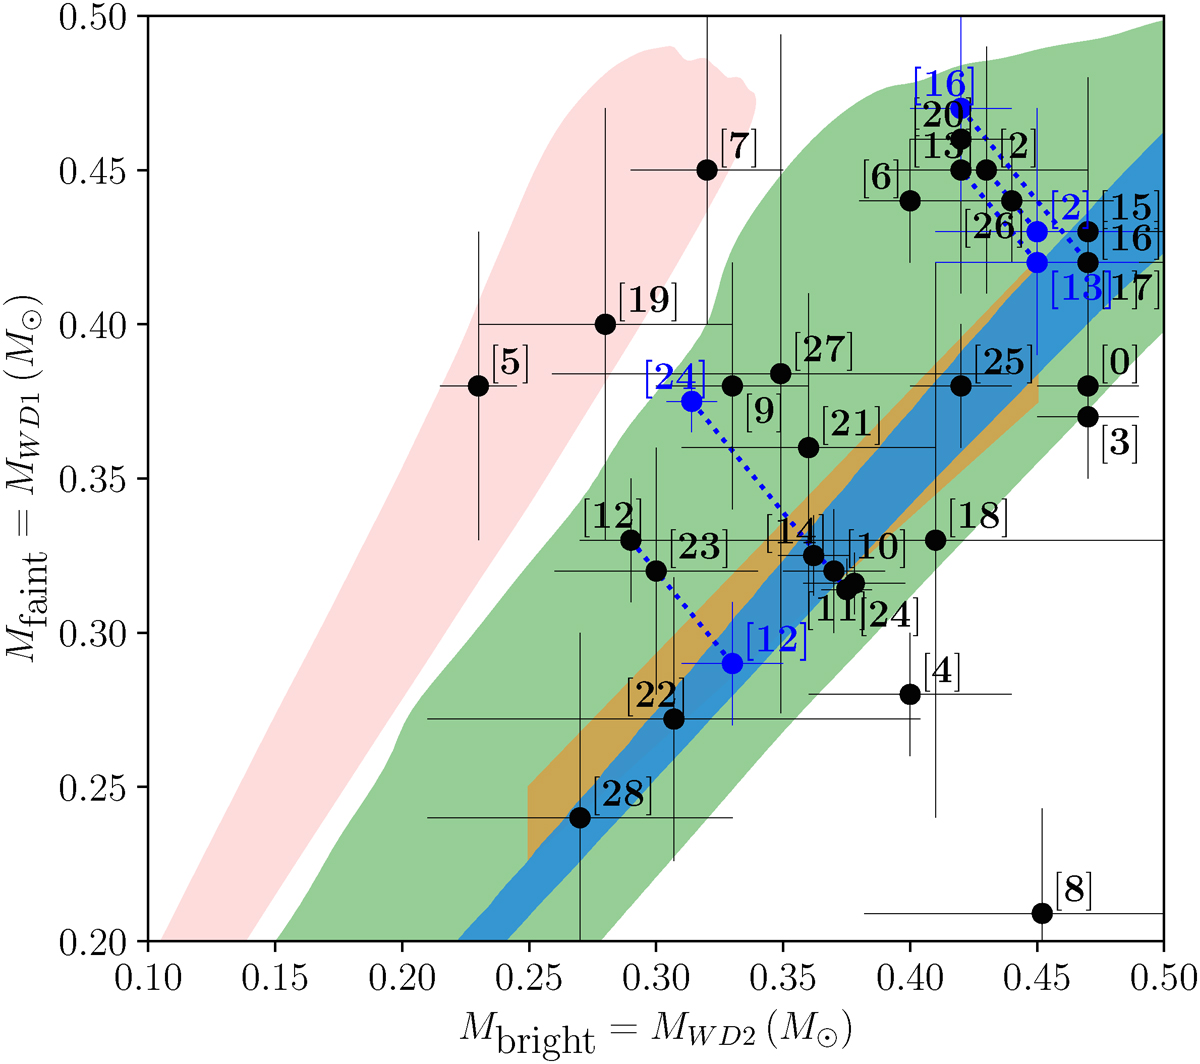
Fig. 3.
Download original image
Predicted mass distribution based on different assumptions for the first phase of mass transfer. In dark blue, we show the predicted masses in the case that the first phase of mass transfer was stable. The orange area underneath covers the range for stable mass transfer as found by Zhang et al. (2024). The results for the case where the first phase of mass transfer was a common envelope with αλ = 2 is shown in light salmon on the far left, and those for the case where the first phase was described by the angular momentum balance with γ = 1.6 are shown in green. The data points and their uncertainties are plotted in black, with the labels indicating the ID of the source in Table 1. The four data points for which the order of formation is not completely clear are plotted in blue and connected with dotted lines with the masses reversed (see text). Systems 1, 16, and 17 have identical masses and thus fall on top of each other.
Current usage metrics show cumulative count of Article Views (full-text article views including HTML views, PDF and ePub downloads, according to the available data) and Abstracts Views on Vision4Press platform.
Data correspond to usage on the plateform after 2015. The current usage metrics is available 48-96 hours after online publication and is updated daily on week days.
Initial download of the metrics may take a while.