Fig. A.2.
Download original image
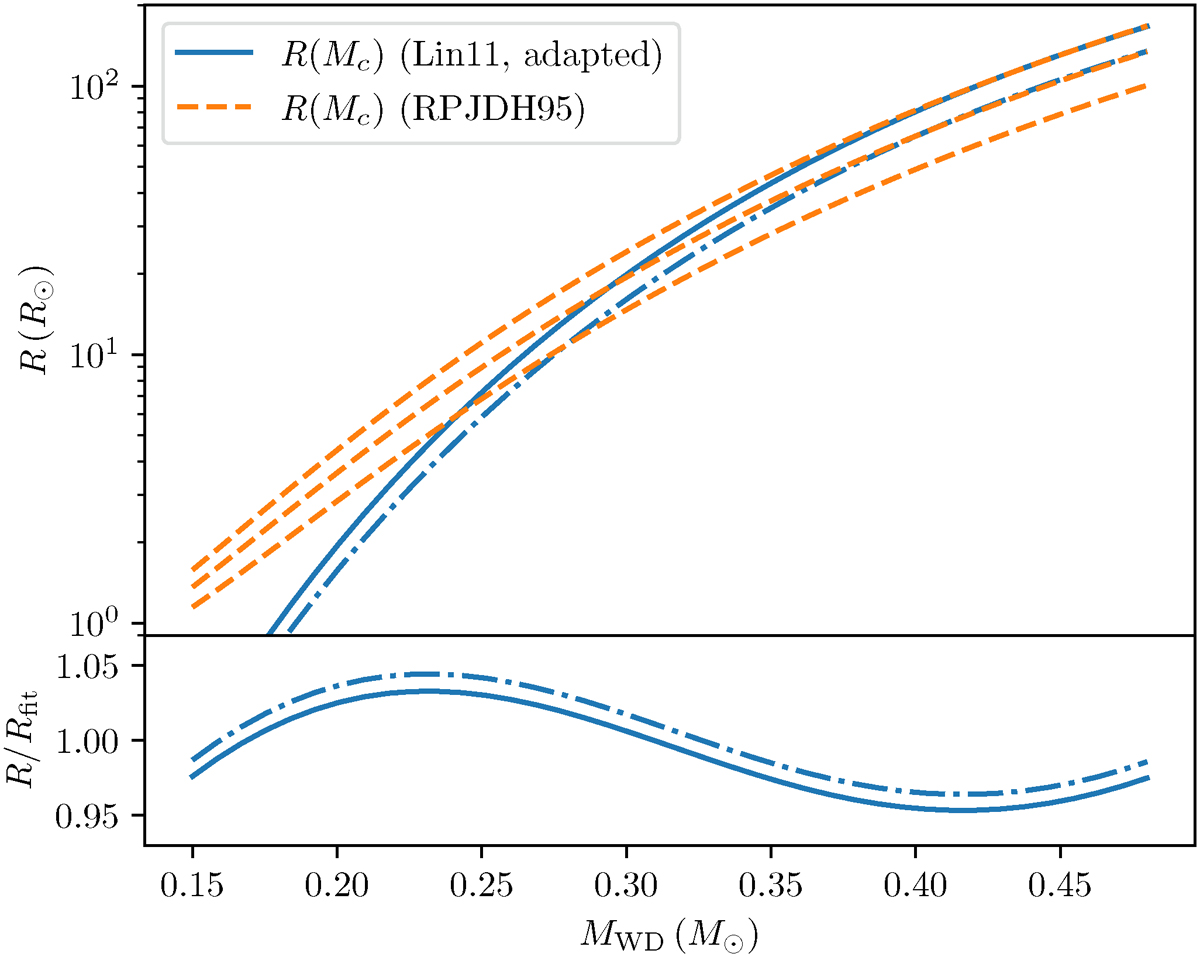
Models from Rappaport et al. (1995), their eq. (5)), orange dashed, for R0 equal to 5500, 4400 and 3300 (top to bottom) which at high core mass are very similar to the Pop I, Pop I+II and Pop II curves of Tauris & Savonije (1999). Our version of the Lin et al. (2011) curves that are adapted to match the other top two curves are shown in blue. The bottom panel shows the residuals between the adapted curves and our simple fit that show that the fit is accurate to within 5 per cent.
Current usage metrics show cumulative count of Article Views (full-text article views including HTML views, PDF and ePub downloads, according to the available data) and Abstracts Views on Vision4Press platform.
Data correspond to usage on the plateform after 2015. The current usage metrics is available 48-96 hours after online publication and is updated daily on week days.
Initial download of the metrics may take a while.