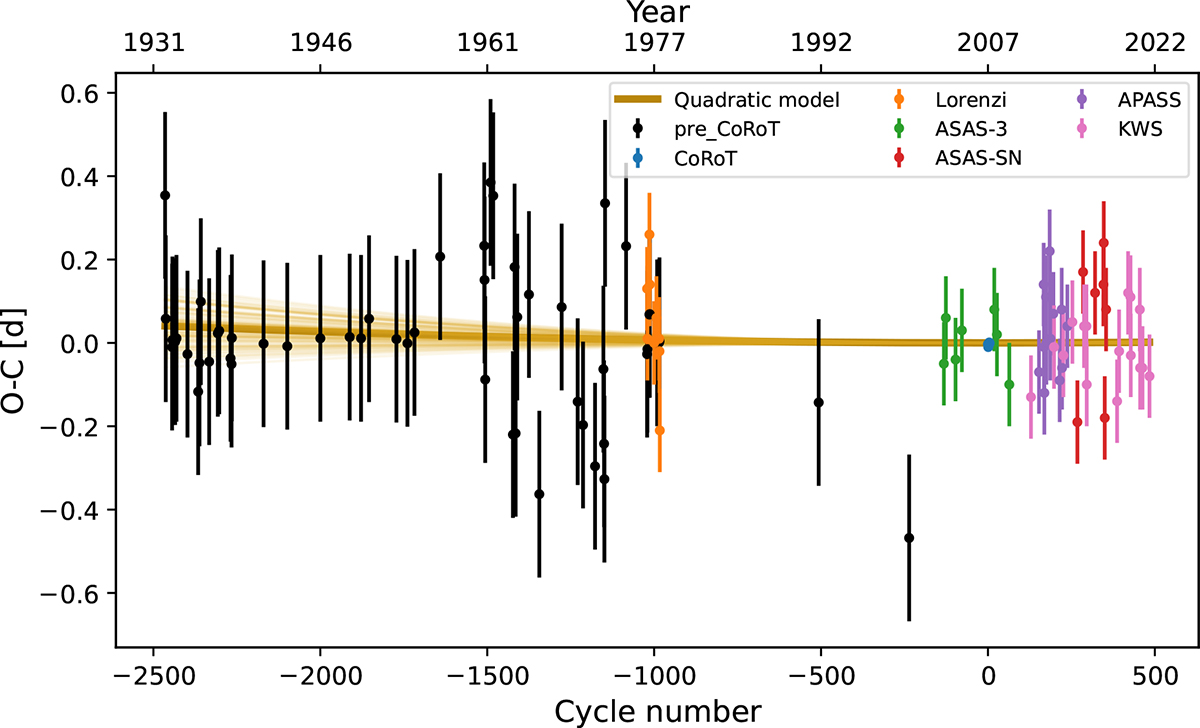
Fig. 2.
Download original image
Observed-calculated (O-C) diagram for values published by D10, including those derived from CoRoT data and previous observations (prevCoRoT), along with the values derived in this work. The best quadratic fit to the data is shown in dark gold, with lighter lines representing 100 random models used to illustrate the uncertainty in the fit parameters.
Current usage metrics show cumulative count of Article Views (full-text article views including HTML views, PDF and ePub downloads, according to the available data) and Abstracts Views on Vision4Press platform.
Data correspond to usage on the plateform after 2015. The current usage metrics is available 48-96 hours after online publication and is updated daily on week days.
Initial download of the metrics may take a while.