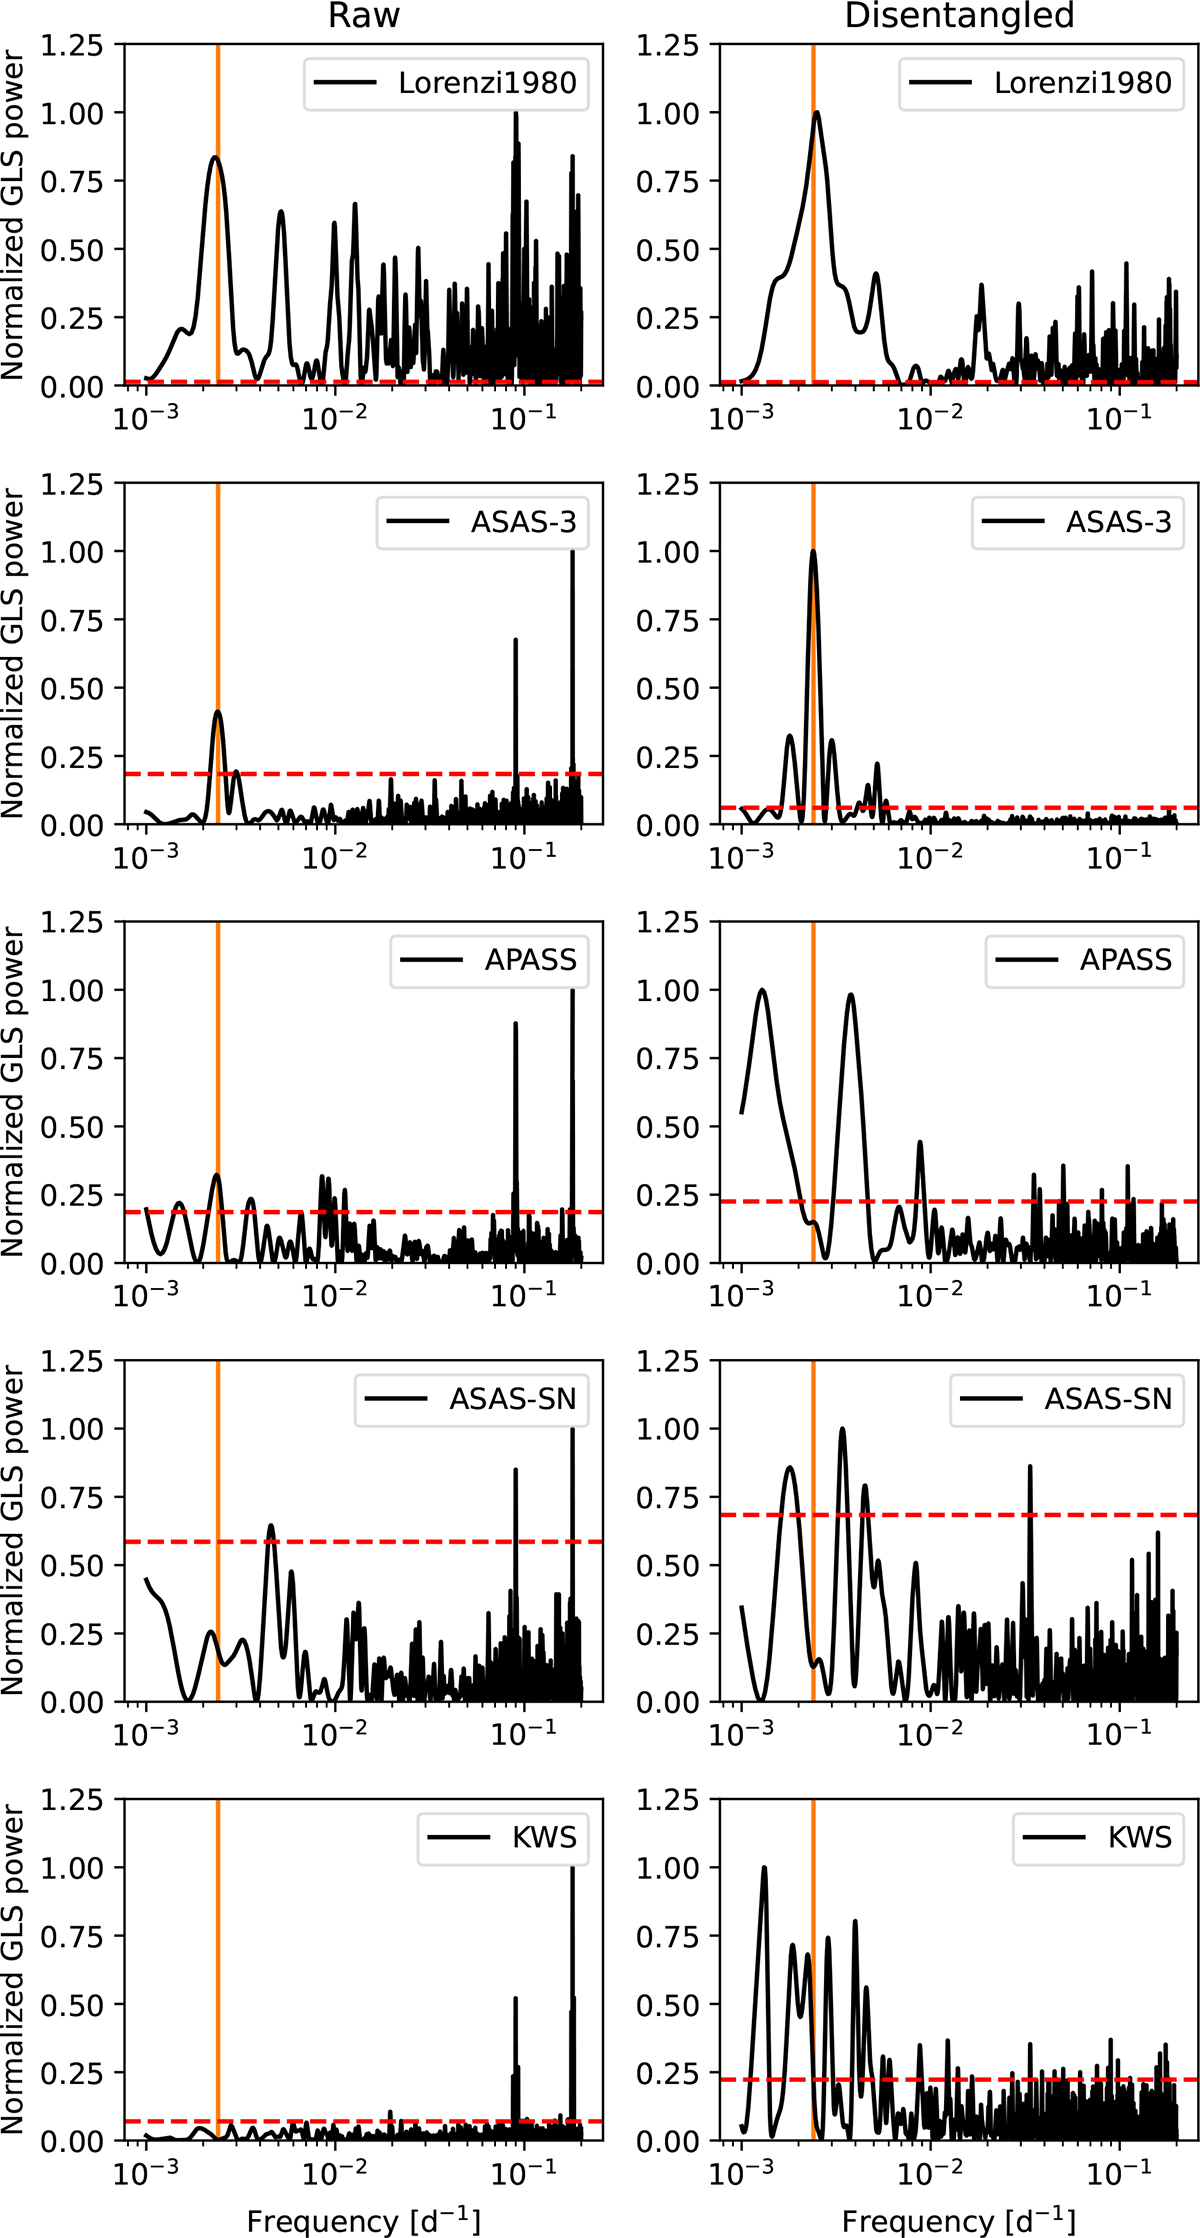
Fig. 3.
Download original image
Normalised GLS periodograms for frequencies between 0.001 d−1 (1000 d) and 0.2 d−1 (5 d) of the raw data (left panels) and the disentangled data (right panels) for the Lorenzi1980, ASAS-3, APASS, ASAS-SN, and KWS datasets. In all panels, a FAP level of 99.9% is indicated by horizontal dashed red lines, while the period of 417 days corresponding to the previously reported long cycle is marked with a vertical orange line.
Current usage metrics show cumulative count of Article Views (full-text article views including HTML views, PDF and ePub downloads, according to the available data) and Abstracts Views on Vision4Press platform.
Data correspond to usage on the plateform after 2015. The current usage metrics is available 48-96 hours after online publication and is updated daily on week days.
Initial download of the metrics may take a while.