Open Access
Fig. 4.
Download original image
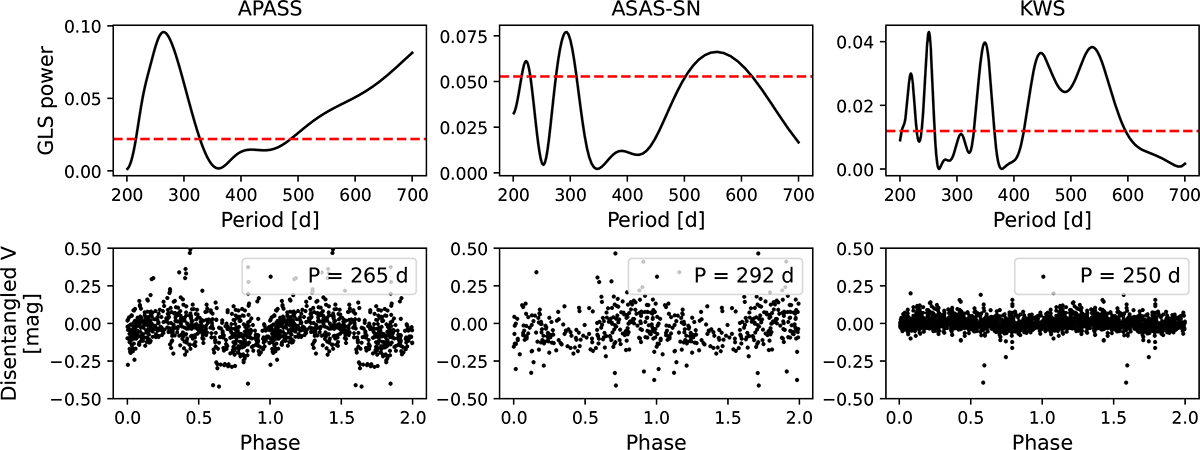
GLS periodograms for the APASS, ASAS-SN, and KWS datasets covering periods between 200 and 700 d (upper row), along with their respective folded light curves against the most significant peak within this range (bottom row). The 99.9% FAP level is indicated by horizontal dashed red lines.
Current usage metrics show cumulative count of Article Views (full-text article views including HTML views, PDF and ePub downloads, according to the available data) and Abstracts Views on Vision4Press platform.
Data correspond to usage on the plateform after 2015. The current usage metrics is available 48-96 hours after online publication and is updated daily on week days.
Initial download of the metrics may take a while.