Fig. 6.
Download original image
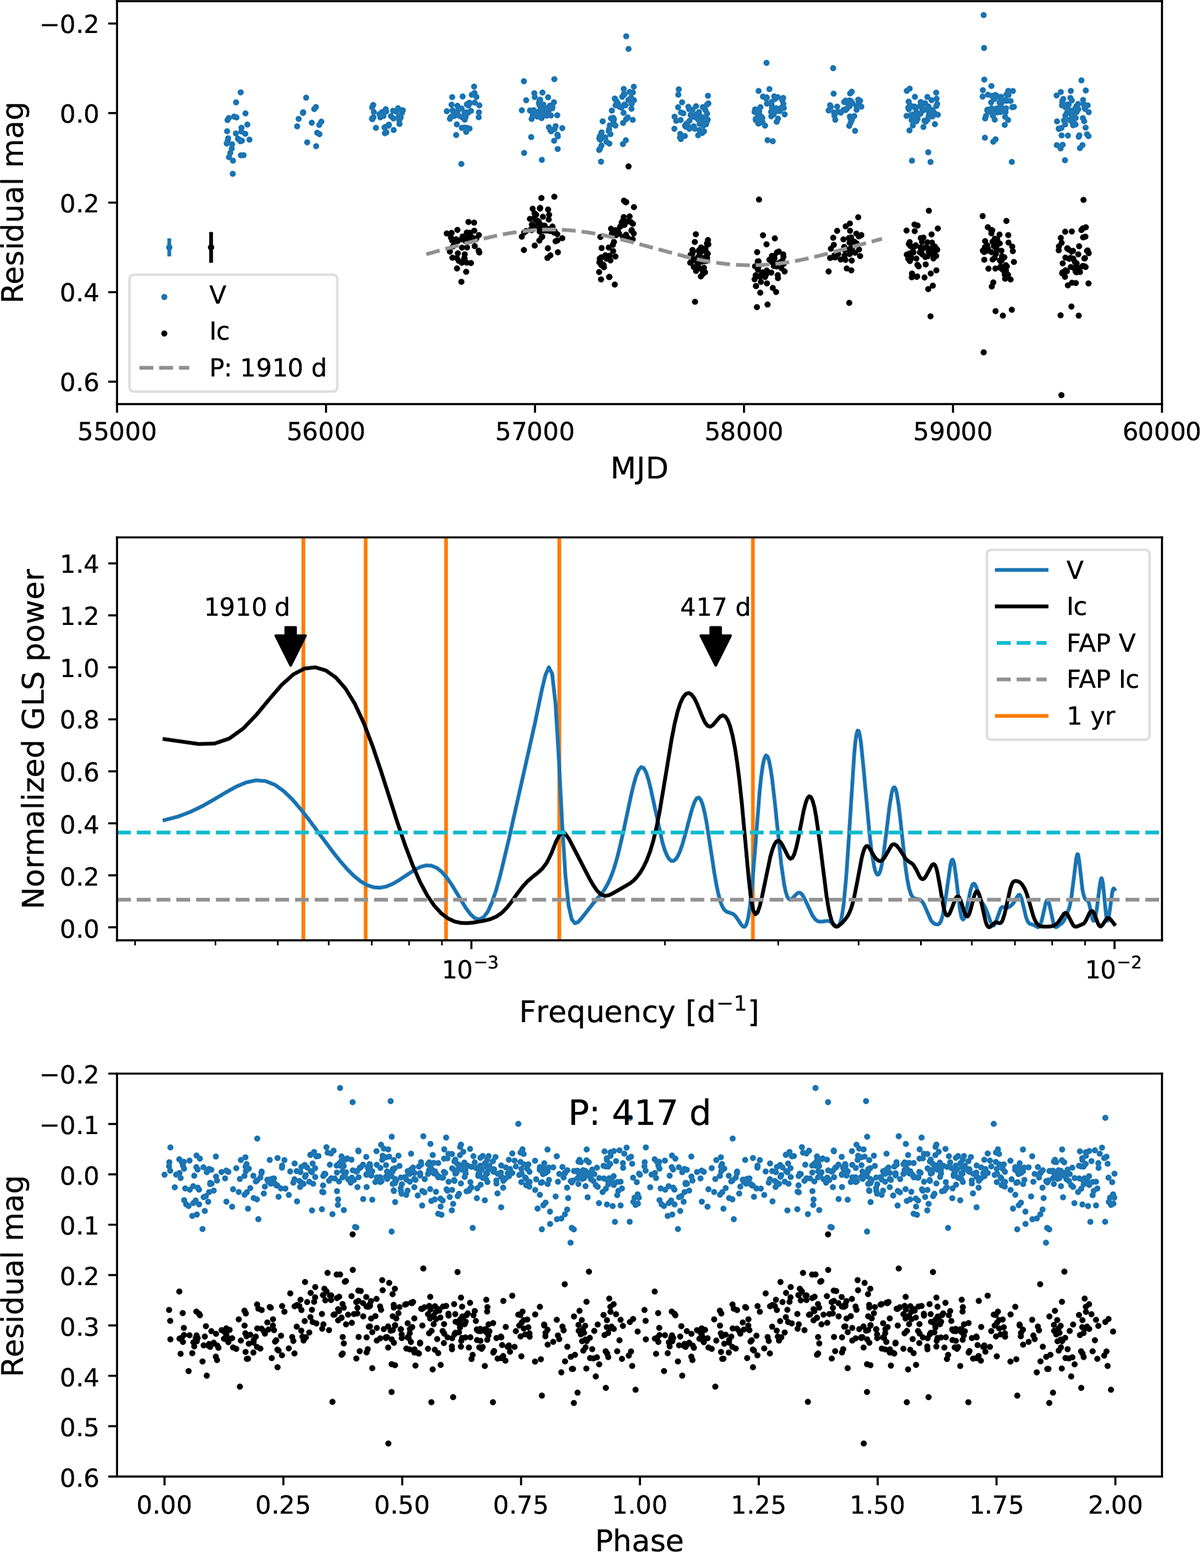
Light curves and periodograms of the disentangled KWS data in the V (blue) and Ic (black) bands. Upper panel: Disentangled light curves with the sinusoidal fit corresponding to a period of 1910 days shown as a dashed grey line. Average magnitude errors for both bands are presented on the left side of the plot. Middle panel: GLS periodograms of the disentangled light curves. The periodograms and their respective FAP limits are normalised to the observed maximum power. Frequencies corresponding to a one-year period and their first five harmonics are marked by orange lines. Arrows indicate frequencies corresponding to the periods of 417 and 1910 days. Bottom panel: Phased light curves corresponding to the period of 417 days.
Current usage metrics show cumulative count of Article Views (full-text article views including HTML views, PDF and ePub downloads, according to the available data) and Abstracts Views on Vision4Press platform.
Data correspond to usage on the plateform after 2015. The current usage metrics is available 48-96 hours after online publication and is updated daily on week days.
Initial download of the metrics may take a while.