Open Access
Fig. 7.
Download original image
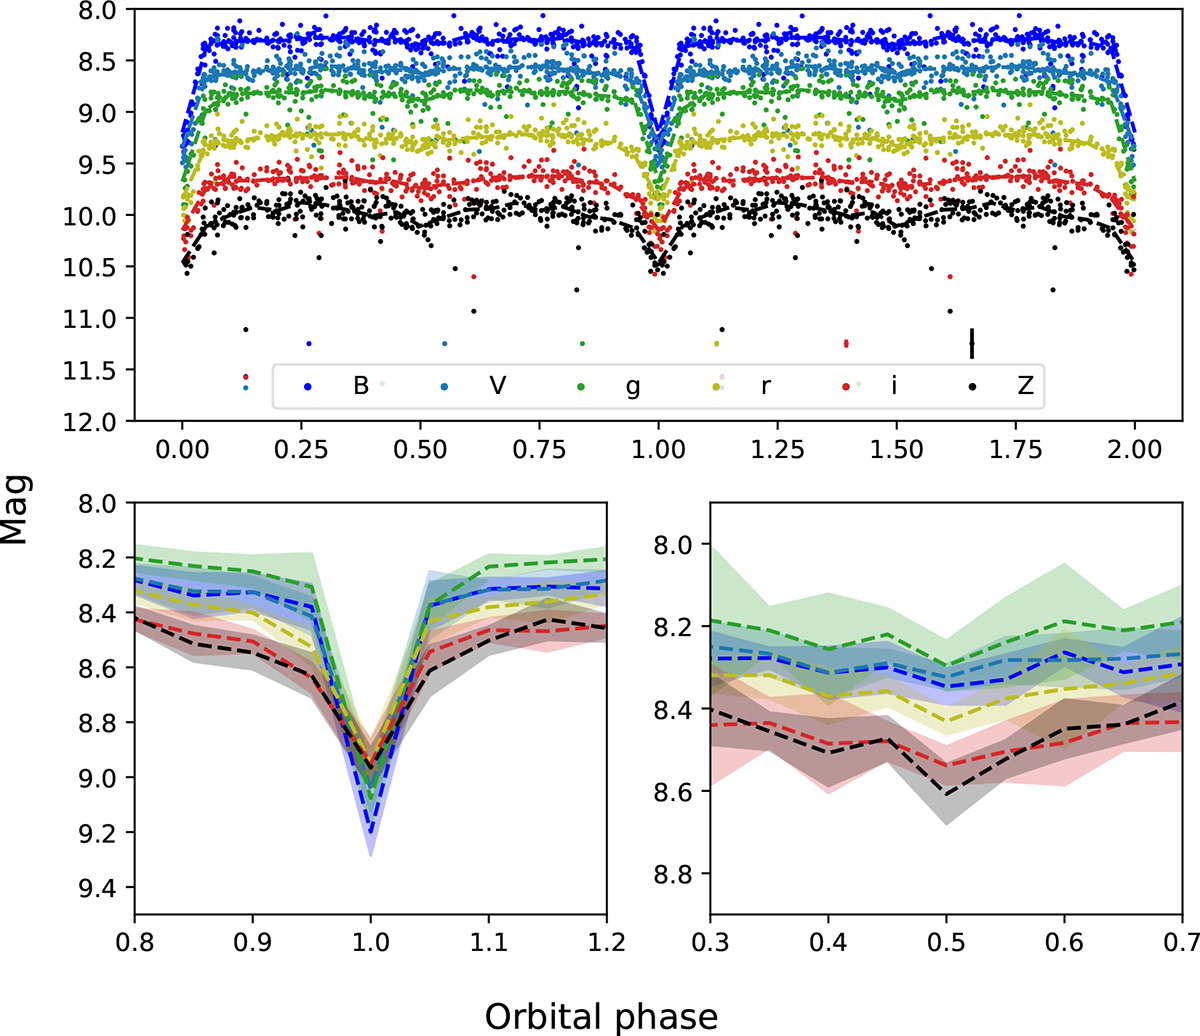
APASS multi-wavelength analysis of the orbital period. Top: APASS light curves in the filters (from top to bottom): B, V, g, r, i, and Z. A shift in magnitude has been applied to every light curve for better visualisation. Bottom: Smoothed light curves without magnitude shift around the primary and secondary eclipse.
Current usage metrics show cumulative count of Article Views (full-text article views including HTML views, PDF and ePub downloads, according to the available data) and Abstracts Views on Vision4Press platform.
Data correspond to usage on the plateform after 2015. The current usage metrics is available 48-96 hours after online publication and is updated daily on week days.
Initial download of the metrics may take a while.