Fig. 1.
Download original image
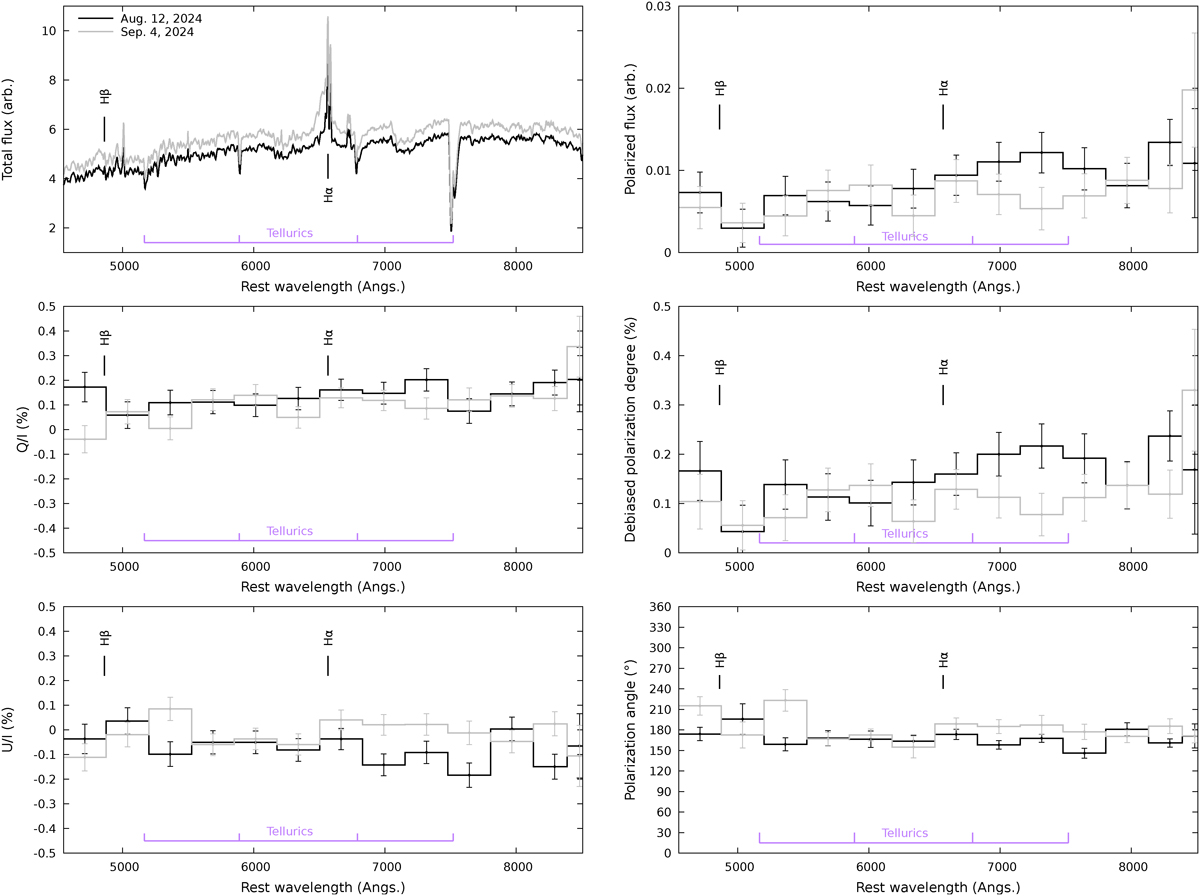
NGC 1346 observation taken with the VLT/FORS2 on August 12, 2024 (solid black line) and on September 4, 2024 (solid gray line). Top-left: Total flux spectra (in arbitrary units, but not renormalized). Middle- and bottom-left: q (=Q/I) and u (=U/I) normalized Stokes parameters. Top-right: Polarized fluxes, that is, the total flux multiplied by the polarization degree. Middle-right: De-biased linear polarization degrees. Bottom-right: Polarization position angles. Except for the total flux panel, spectra were re-binned to 100 consecutive pixels. Observational errors are indicated for each spectral bin, and the locations of Hα and Hβ emission lines, as well as the strongest atmospheric absorption bands (tellurics), are clearly indicated.
Current usage metrics show cumulative count of Article Views (full-text article views including HTML views, PDF and ePub downloads, according to the available data) and Abstracts Views on Vision4Press platform.
Data correspond to usage on the plateform after 2015. The current usage metrics is available 48-96 hours after online publication and is updated daily on week days.
Initial download of the metrics may take a while.