Fig. 3.
Download original image
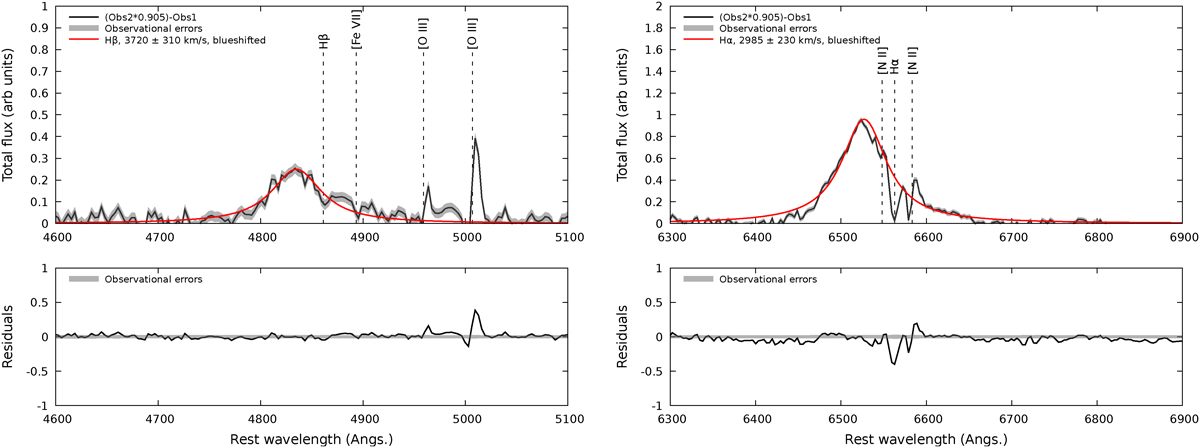
Top: Lorentzian fits of the newly appeared broad emission features in the September spectrum. The fitted data are the ones presented in Fig. 2. The centroid wavelength (in air) of various emission lines is indicated. Bottom: Residuals. Observational errors are indicated in transparent gray. The left column is for the Hβ emission line, while the right column shows the fits of the Hα feature.
Current usage metrics show cumulative count of Article Views (full-text article views including HTML views, PDF and ePub downloads, according to the available data) and Abstracts Views on Vision4Press platform.
Data correspond to usage on the plateform after 2015. The current usage metrics is available 48-96 hours after online publication and is updated daily on week days.
Initial download of the metrics may take a while.