Fig. 1.
Download original image
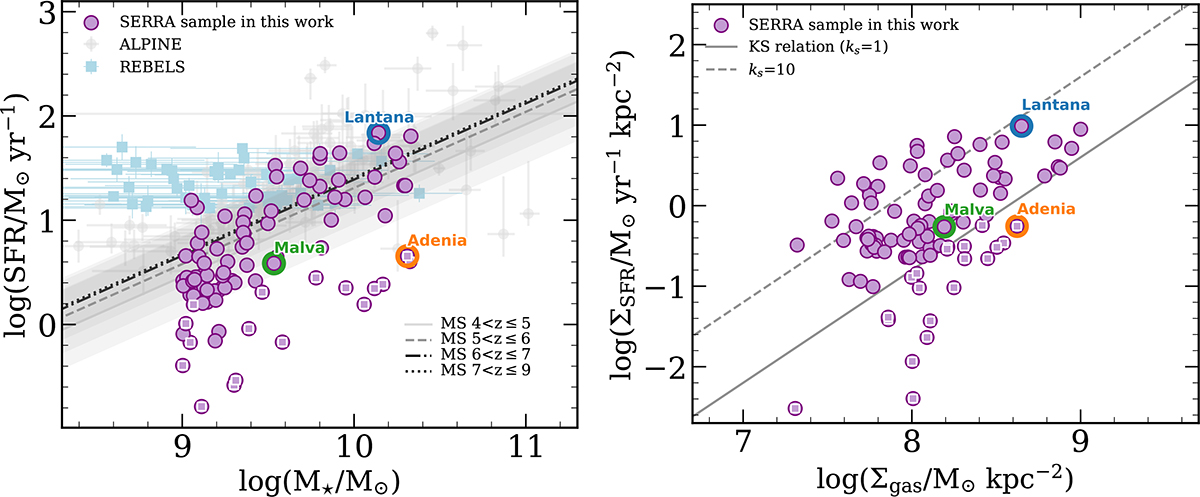
Left panel: SFR vs. M⋆ relation for the SERRA sample (purple points), along with the MS parametrization in the CEERS sample in different redshift bins (gray lines), with their 1σ scatter (gray shaded areas) for 100 Myr-averaged SFRs (Cole et al. 2025). The SFR vs. M⋆ relations of ALPINE (Khusanova et al. 2021, gray points) and REBELS (Inami et al. 2022; Topping et al. 2022, light blue squares) are also plotted for comparison. Right panel: ΣSFR vs. Σgas KS relation for the SERRA galaxies. The local KS relation is plotted with a solid gray line, and that obtained for burstiness parameter κs = 10 with a dashed gray line. Those sources that were below the KS relation (points with a white inner square) also fall below the MS. In both plots we highlight the three example galaxies discussed in Sect. 3 and whose cutouts are presented in Fig. 2.
Current usage metrics show cumulative count of Article Views (full-text article views including HTML views, PDF and ePub downloads, according to the available data) and Abstracts Views on Vision4Press platform.
Data correspond to usage on the plateform after 2015. The current usage metrics is available 48-96 hours after online publication and is updated daily on week days.
Initial download of the metrics may take a while.