Fig. 3.
Download original image
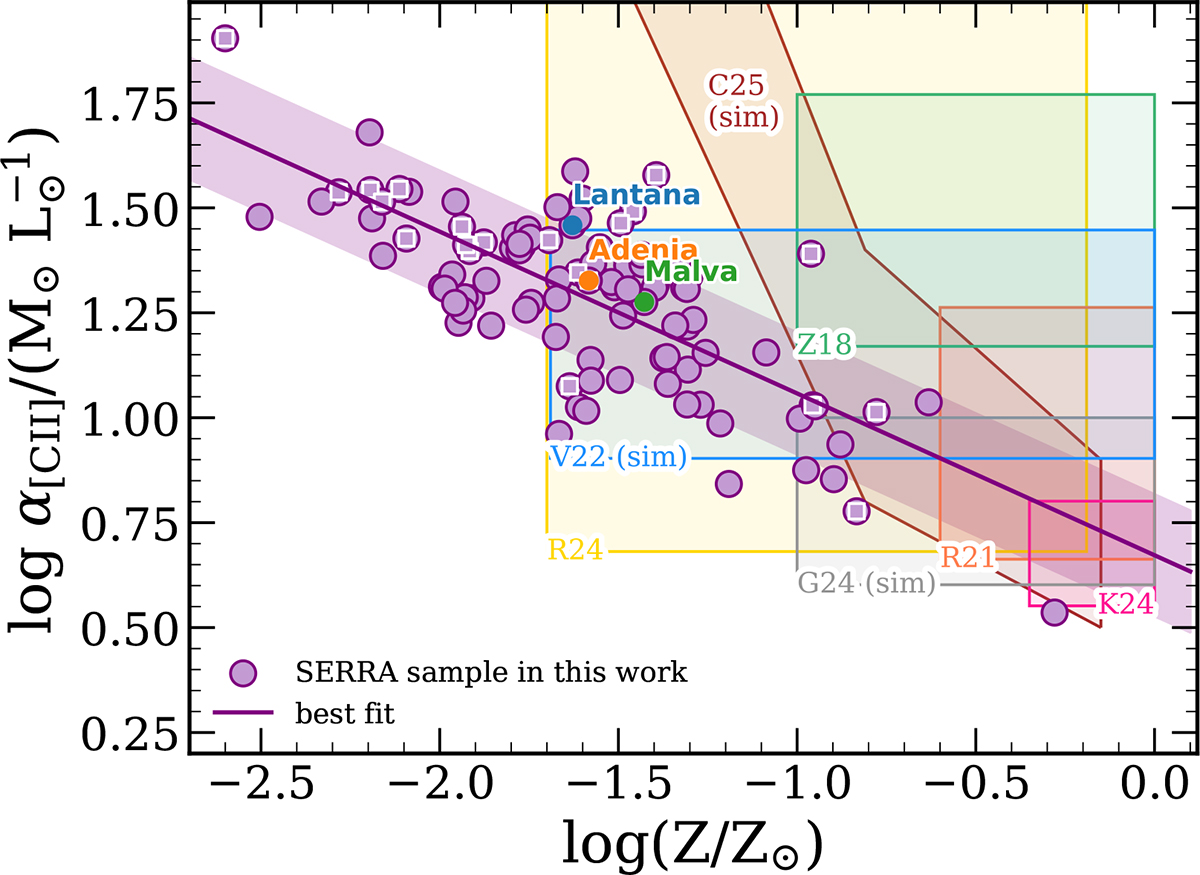
α[CII] vs. log Z for the SERRA galaxies (purple points, with inner white squares if they fall below the local KS relation) along with the best-fit linear regression ±1σ dispersion (purple line and shaded area). Lantana, Adenia, and Malva are plotted in blue, orange, and green, respectively. Previous derivations of α[CII] in the literature are shown with shaded areas as follows: the green shaded area represents the Zanella et al. (2018) results (log α[CII] = 1.5 with 0.3 dex dispersion over log(Z/Z⊙)≈[−1, 0.0]); the yellow shaded area the Ramambason et al. (2024) results (converted into M⊙ L⊙−1 units, over log(Z/Z⊙)≈[−1.69, −0.3] range); the orange shaded area the Rizzo et al. (2021) results (log α[CII] = [0.66, 1.3] assuming a fiducial range log(Z/Z⊙)≈[−0.5, 0.0] for the dusty star-forming galaxies in the sample); and the pink shaded box the results from Kaasinen et al. (2024), who report α[CII] = 4.6 ± 1.6× lower than Zanella et al. (2018), over log(Z/Z⊙)≈[−0.3, 0.0] for the quasi-stellar objects in their sample. Cosmological and single cloud simulations (labeled “sim”) from Vizgan et al. (2022) and Gurman et al. (2024) are almost constant within their Z range, and are plotted in blue and gray, respectively. The α[CII] − Z⋆ relation from Casavecchia et al. (2025) is shown in brown.
Current usage metrics show cumulative count of Article Views (full-text article views including HTML views, PDF and ePub downloads, according to the available data) and Abstracts Views on Vision4Press platform.
Data correspond to usage on the plateform after 2015. The current usage metrics is available 48-96 hours after online publication and is updated daily on week days.
Initial download of the metrics may take a while.