Fig. 5.
Download original image
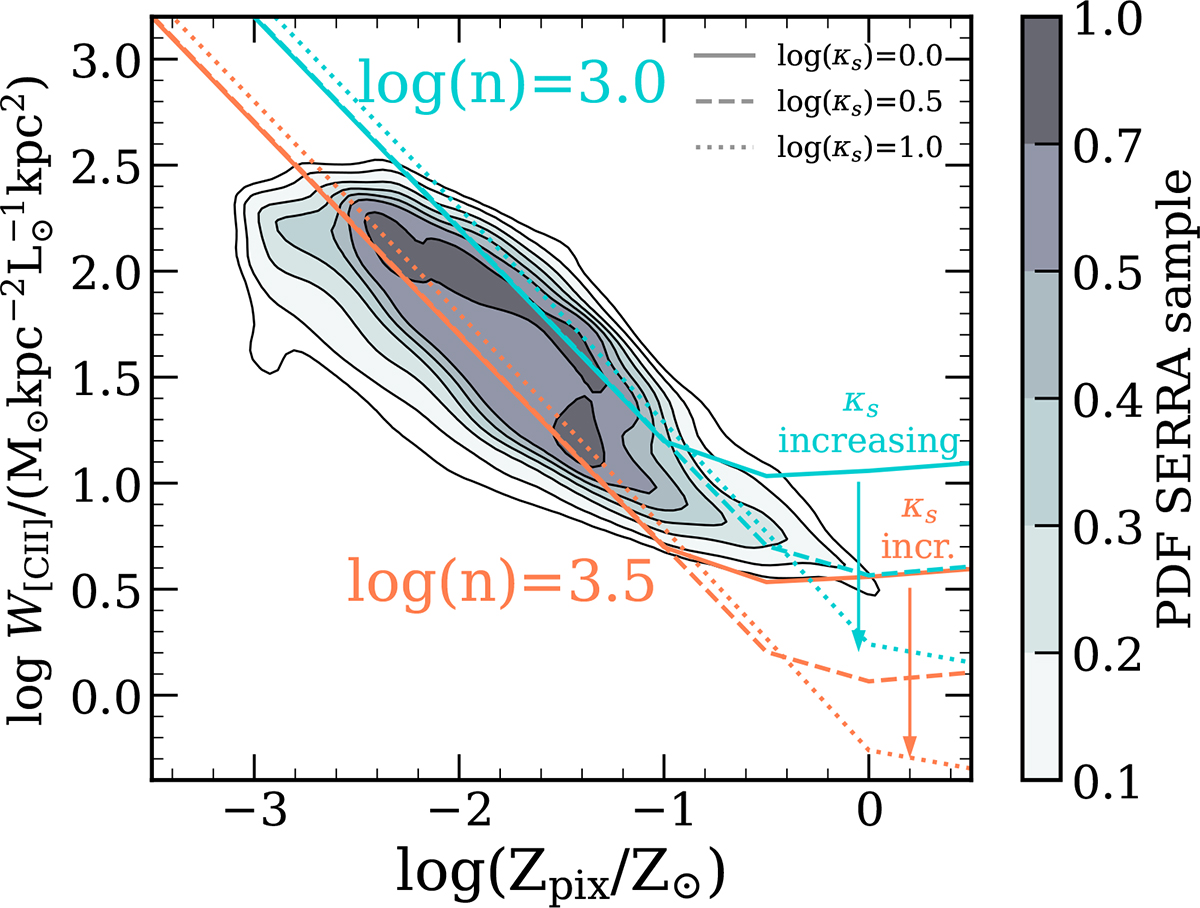
2D PDF of the spatially resolved conversion factor (W[CII]) as a function of the spatially resolved metallicity (Zpix) from the entire sample of SERRA sources. For comparison, we plot the theoretical estimates obtained with the ferrara2019 model assuming gas densities log(n/cm−3) = 3 (red) and log(n/cm−3) = 3.5 (cyan). We plot the results with burstiness parameters of log κs = 0 (solid lines), log κs = 0.5 (dashed lines), and log κs = 1.0 (dotted lines).
Current usage metrics show cumulative count of Article Views (full-text article views including HTML views, PDF and ePub downloads, according to the available data) and Abstracts Views on Vision4Press platform.
Data correspond to usage on the plateform after 2015. The current usage metrics is available 48-96 hours after online publication and is updated daily on week days.
Initial download of the metrics may take a while.