Fig. 7.
Download original image
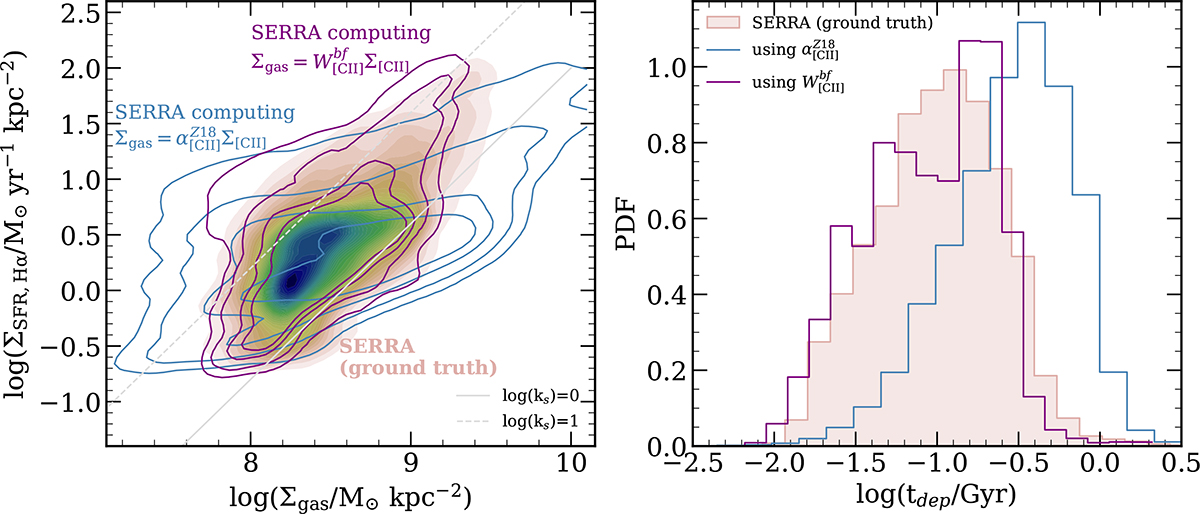
Left: Spatially resolved KS relation considering ≈30 × 30 pc2 pixels drawn from the entire sample of SERRA galaxies (color-coded, ground truth). For each pixel the ΣSFR, Hα is derived from the Hα surface brightness using the Kennicutt (1998) relation, and the Σgas is taken from the simulation. For comparison, blue contours show the inferred location of the pixels on the KS plane assuming ![]() , namely adopting a constant Zanella et al. (2018) conversion factor to get the gas surface density from Σ[CII]. The location in the KS plane found when using the best-fit spatially resolved conversion factor, W[CII] (Eq. (10)), is plotted in purple. Right: L[CII]-weighted distribution of the depletion time (tdep) in the SERRA pixels (shaded histogram), that inferred using
, namely adopting a constant Zanella et al. (2018) conversion factor to get the gas surface density from Σ[CII]. The location in the KS plane found when using the best-fit spatially resolved conversion factor, W[CII] (Eq. (10)), is plotted in purple. Right: L[CII]-weighted distribution of the depletion time (tdep) in the SERRA pixels (shaded histogram), that inferred using ![]() to determine the Σgas (blue), and that obtained using the W[CII] from Eq. (10).
to determine the Σgas (blue), and that obtained using the W[CII] from Eq. (10).
Current usage metrics show cumulative count of Article Views (full-text article views including HTML views, PDF and ePub downloads, according to the available data) and Abstracts Views on Vision4Press platform.
Data correspond to usage on the plateform after 2015. The current usage metrics is available 48-96 hours after online publication and is updated daily on week days.
Initial download of the metrics may take a while.