Fig. 10
Download original image
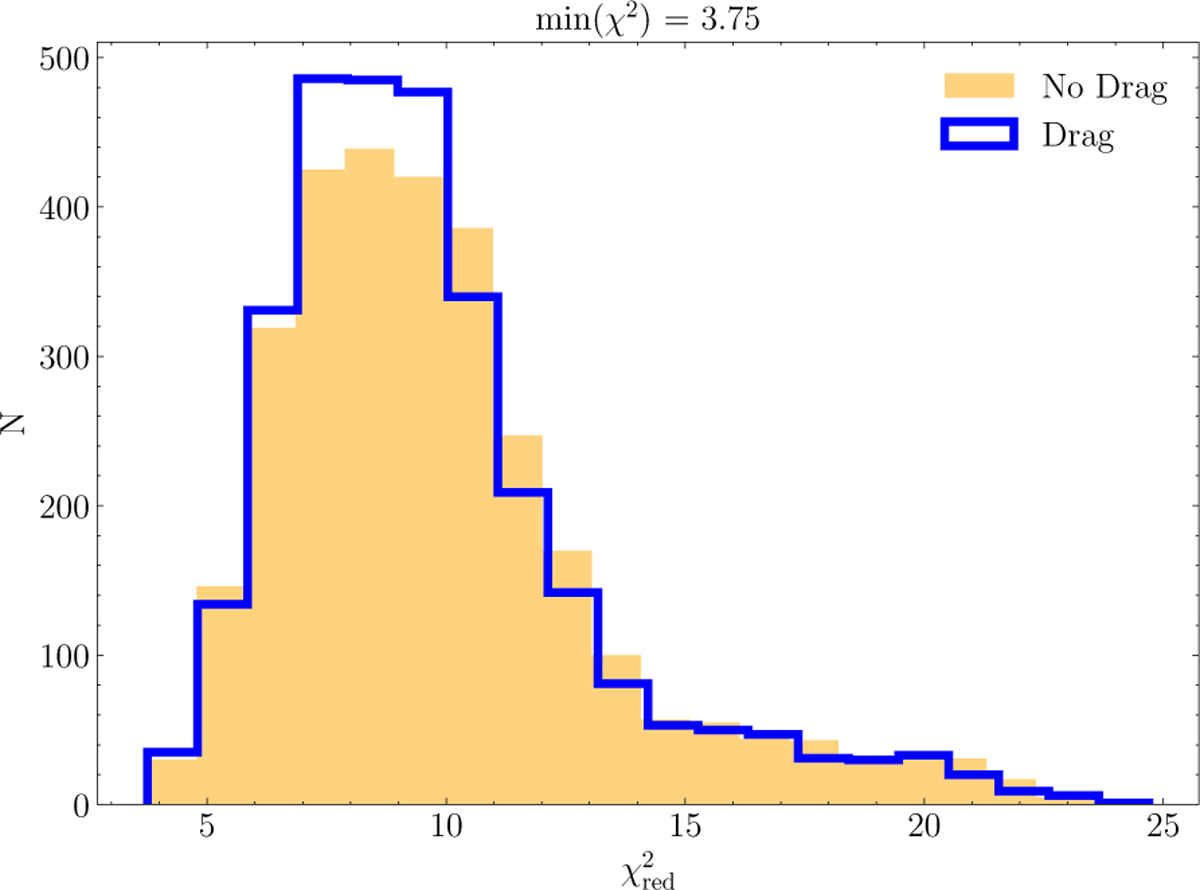
Histogram of the ![]() distribution of the 3000 realizations of the simulated cloud with initial conditions obtained from sampling the posterior distribution of the orbital fit of X7. The solid blue line and orange area represent the results of the fiducial case and the one considering the drag force of the ambient medium, respectively. The minimum value is
distribution of the 3000 realizations of the simulated cloud with initial conditions obtained from sampling the posterior distribution of the orbital fit of X7. The solid blue line and orange area represent the results of the fiducial case and the one considering the drag force of the ambient medium, respectively. The minimum value is ![]() in both cases.
in both cases.
Current usage metrics show cumulative count of Article Views (full-text article views including HTML views, PDF and ePub downloads, according to the available data) and Abstracts Views on Vision4Press platform.
Data correspond to usage on the plateform after 2015. The current usage metrics is available 48-96 hours after online publication and is updated daily on week days.
Initial download of the metrics may take a while.