Fig. 11
Download original image
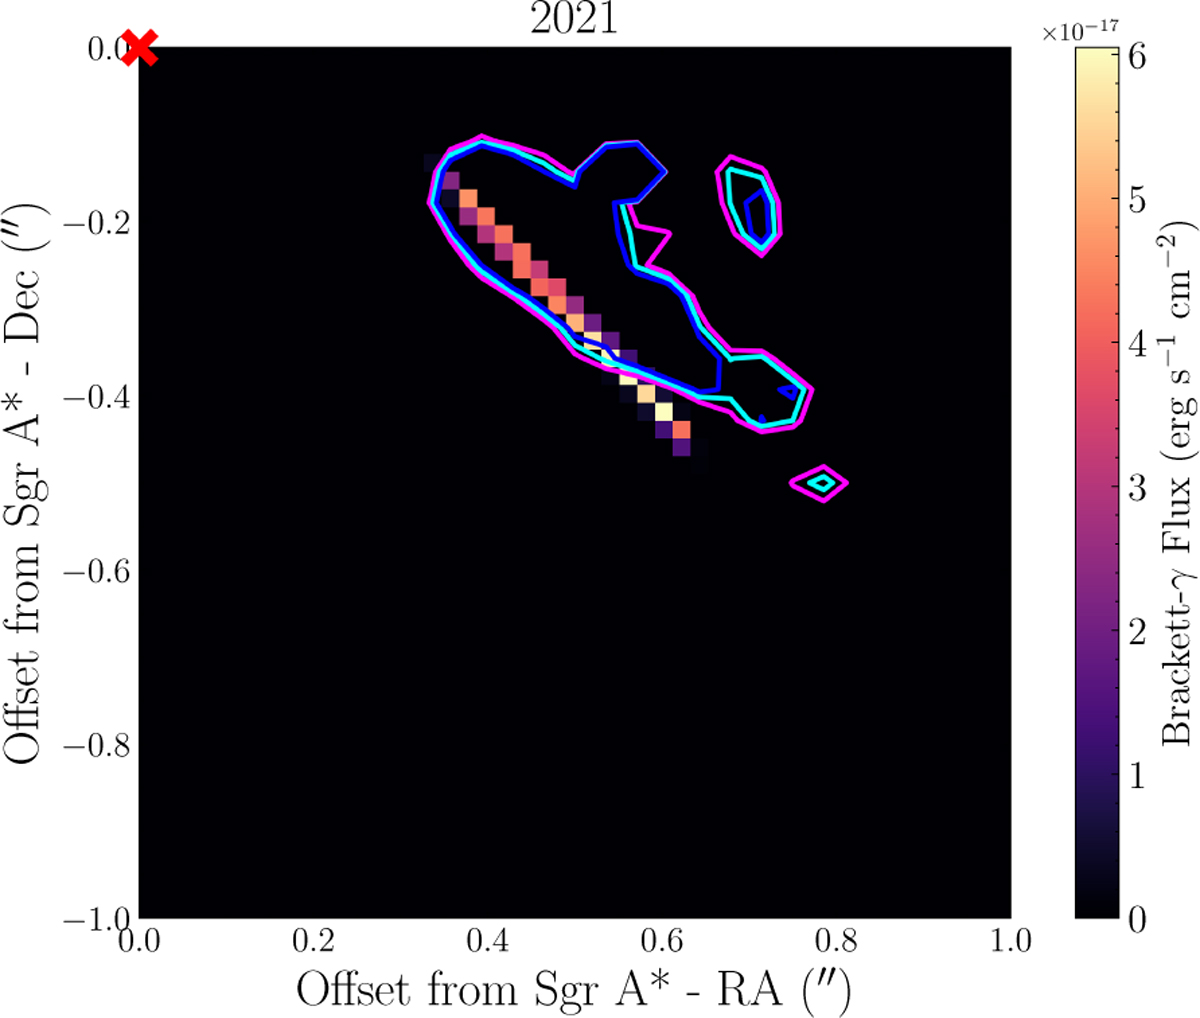
Comparison of the morphology ofX7 and the simulated cloud through the observed (contours) and simulated (color map) Brγ images in 2021. The contour levels represent 0.25 (blue), 0.275 (cyan), and 0.30 (magenta) of the Brγ emission maximum. The sky area shown is 1″ × 1″, with Sgr A* located in the top-left corner of the plot.
Current usage metrics show cumulative count of Article Views (full-text article views including HTML views, PDF and ePub downloads, according to the available data) and Abstracts Views on Vision4Press platform.
Data correspond to usage on the plateform after 2015. The current usage metrics is available 48-96 hours after online publication and is updated daily on week days.
Initial download of the metrics may take a while.