Fig. A.1
Download original image
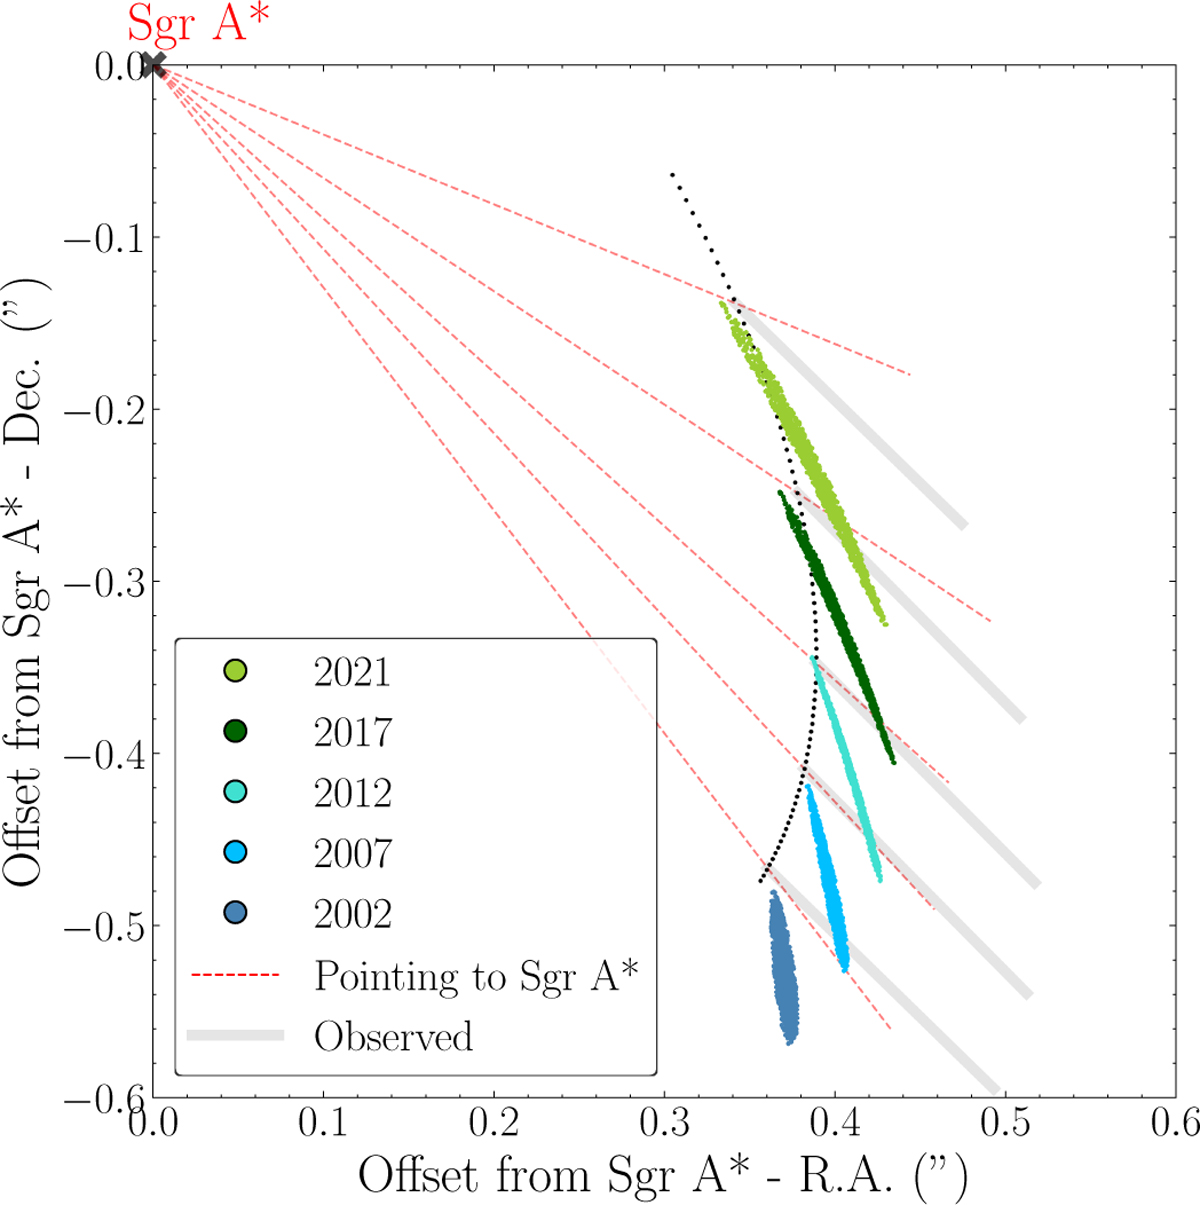
Comparison of the orientation of the initially spherical simulated cloud and X7. The sky-projected morphology of the simulated cloud is shown at t = 2002, 2007, 2012, 2017, and 2021 yr as dark blue, light blue, cyan, dark green, and light green dots, respectively. The gray shaded lines show the observed orientation of X7 (Ciurlo et al. 2023). The dashed red line represents the lines connecting Sgr A* and the location of the tip of X7 at a given epoch. Sgr A* is located in the top-left corner.
Current usage metrics show cumulative count of Article Views (full-text article views including HTML views, PDF and ePub downloads, according to the available data) and Abstracts Views on Vision4Press platform.
Data correspond to usage on the plateform after 2015. The current usage metrics is available 48-96 hours after online publication and is updated daily on week days.
Initial download of the metrics may take a while.