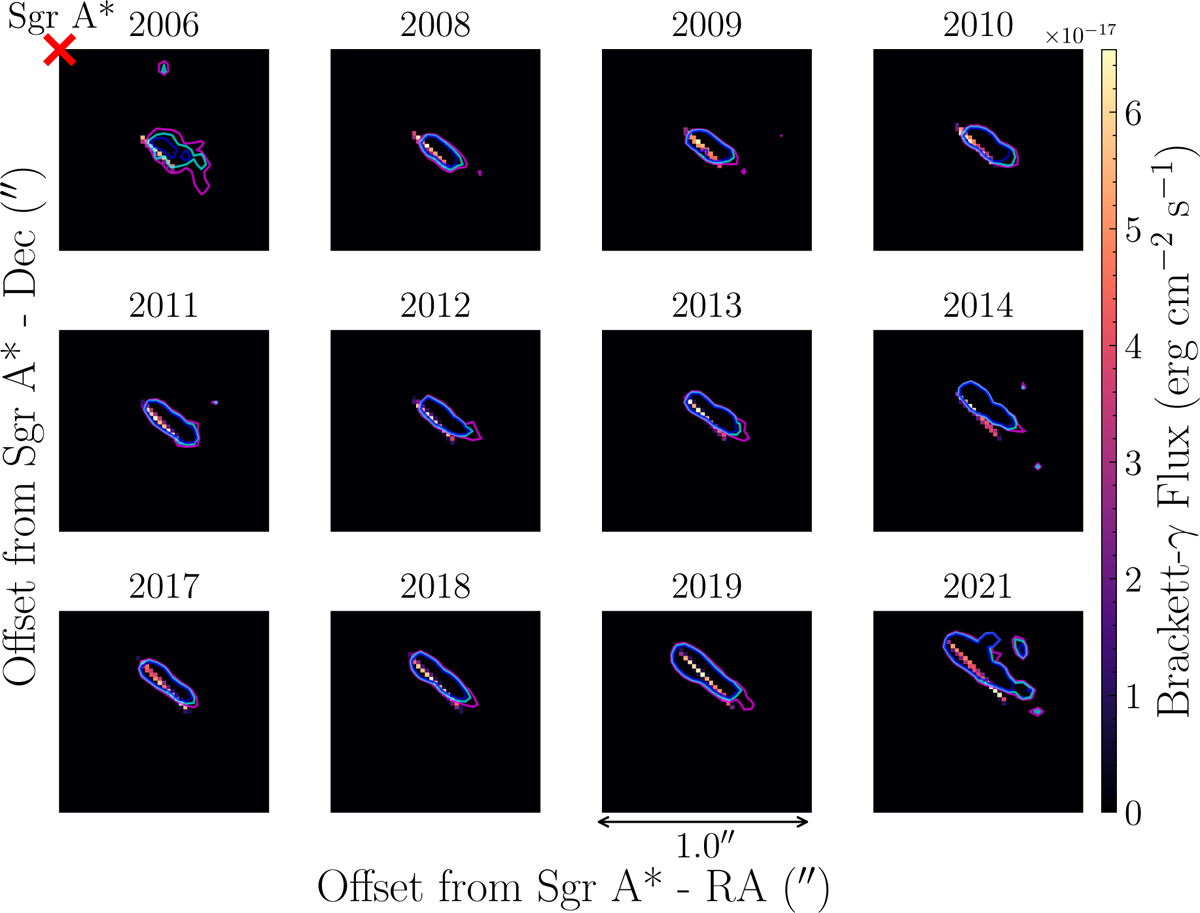
Fig. C.1
Download original image
Comparison of the morphological evolution of X7 and the simulated cloud. The panels show sky-projected 1″ × 1″Brγ images and highlight the emission from X7 with contours in the period 2006-2021. The simulated cloud is overlaid with colored markers that encode the simulated Brγ flux. The position of Sgr A* is in the top-left corner of each panel. North is up and east to the left.
Current usage metrics show cumulative count of Article Views (full-text article views including HTML views, PDF and ePub downloads, according to the available data) and Abstracts Views on Vision4Press platform.
Data correspond to usage on the plateform after 2015. The current usage metrics is available 48-96 hours after online publication and is updated daily on week days.
Initial download of the metrics may take a while.