Fig. 2
Download original image
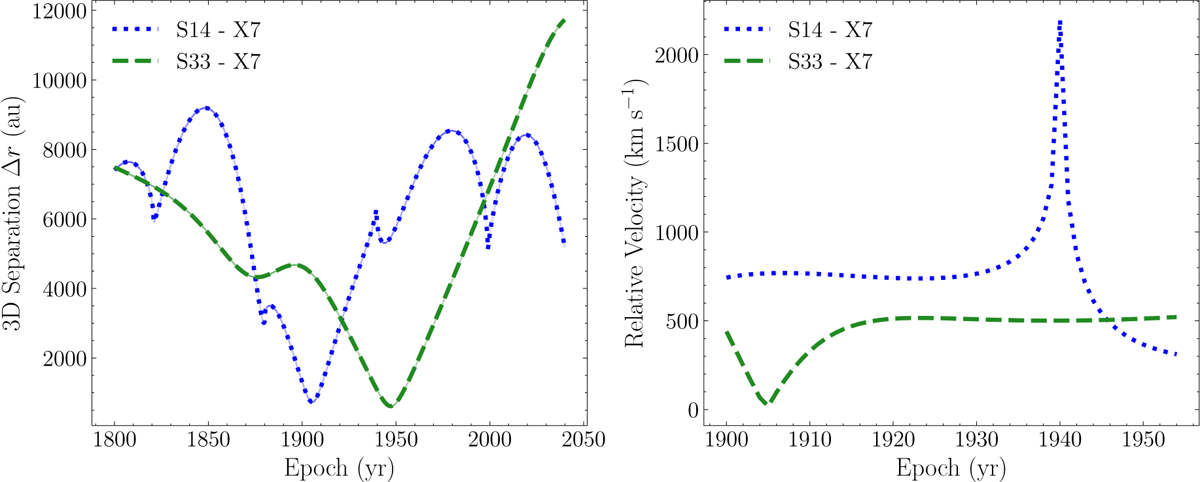
Three-dimensional separation (left) and relative velocity (right) between stars and X7 as a function of time. The two stars closest to X7, S14/S0-16 and S33/S0-30, are shown. S14/S0-16-X7 is displayed as a dotted blue line and S33/S0-30-X7 as a dashed green line. The calculations are shown in the time periods 1800-2050 (left) and 1900-1950 (right).
Current usage metrics show cumulative count of Article Views (full-text article views including HTML views, PDF and ePub downloads, according to the available data) and Abstracts Views on Vision4Press platform.
Data correspond to usage on the plateform after 2015. The current usage metrics is available 48-96 hours after online publication and is updated daily on week days.
Initial download of the metrics may take a while.