Fig. 4
Download original image
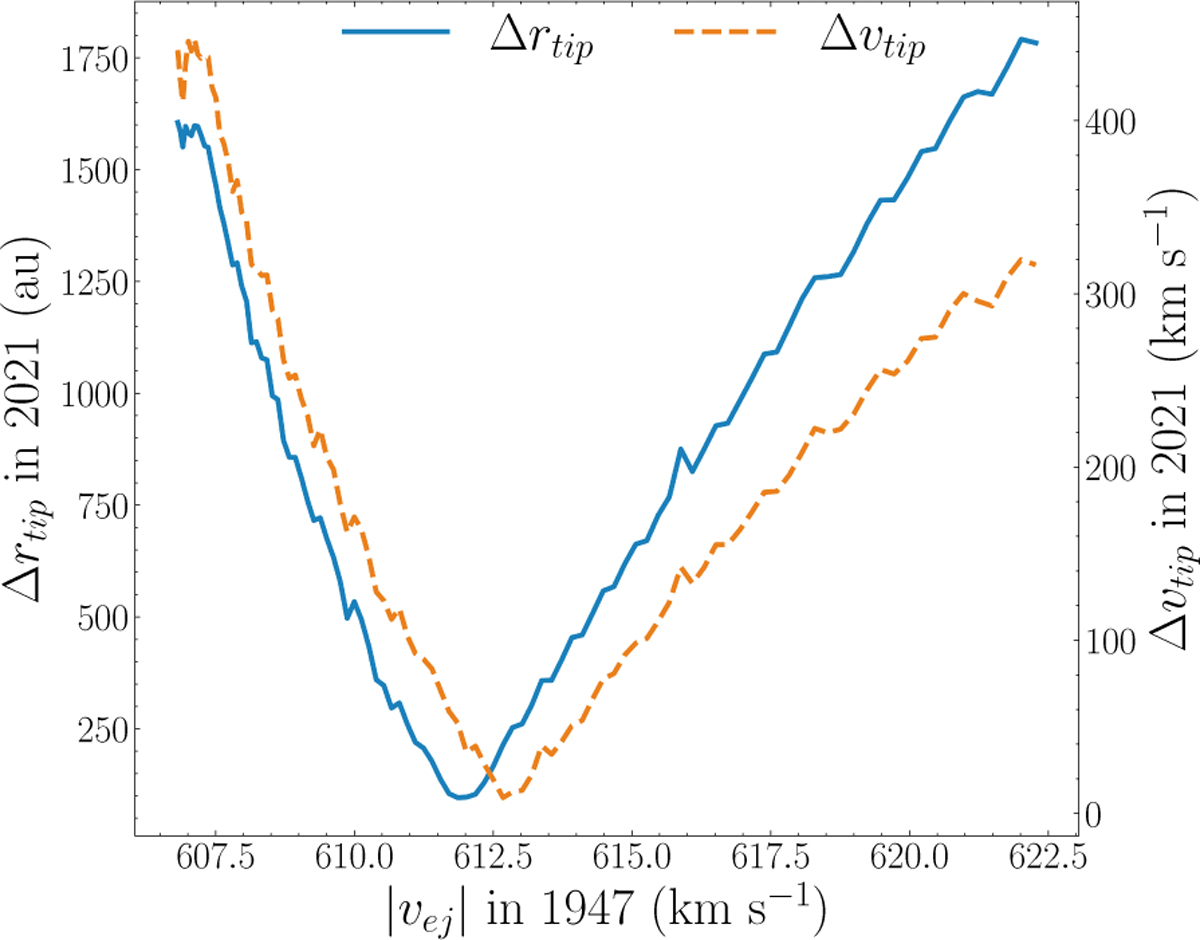
Three-dimensional separation (Δrtip) and relative velocity (Δvtip) between the tip of the simulated cloud and X7 in 2021 as a function of the magnitude of initial velocity (|vej|) of the simulated cloud. The solid blue and dashed orange lines represent Δrtip and Δνtip, respectively. Notice that both quantities have a minimum at |vej| ~ 612 km s−1.
Current usage metrics show cumulative count of Article Views (full-text article views including HTML views, PDF and ePub downloads, according to the available data) and Abstracts Views on Vision4Press platform.
Data correspond to usage on the plateform after 2015. The current usage metrics is available 48-96 hours after online publication and is updated daily on week days.
Initial download of the metrics may take a while.