Fig. 7
Download original image
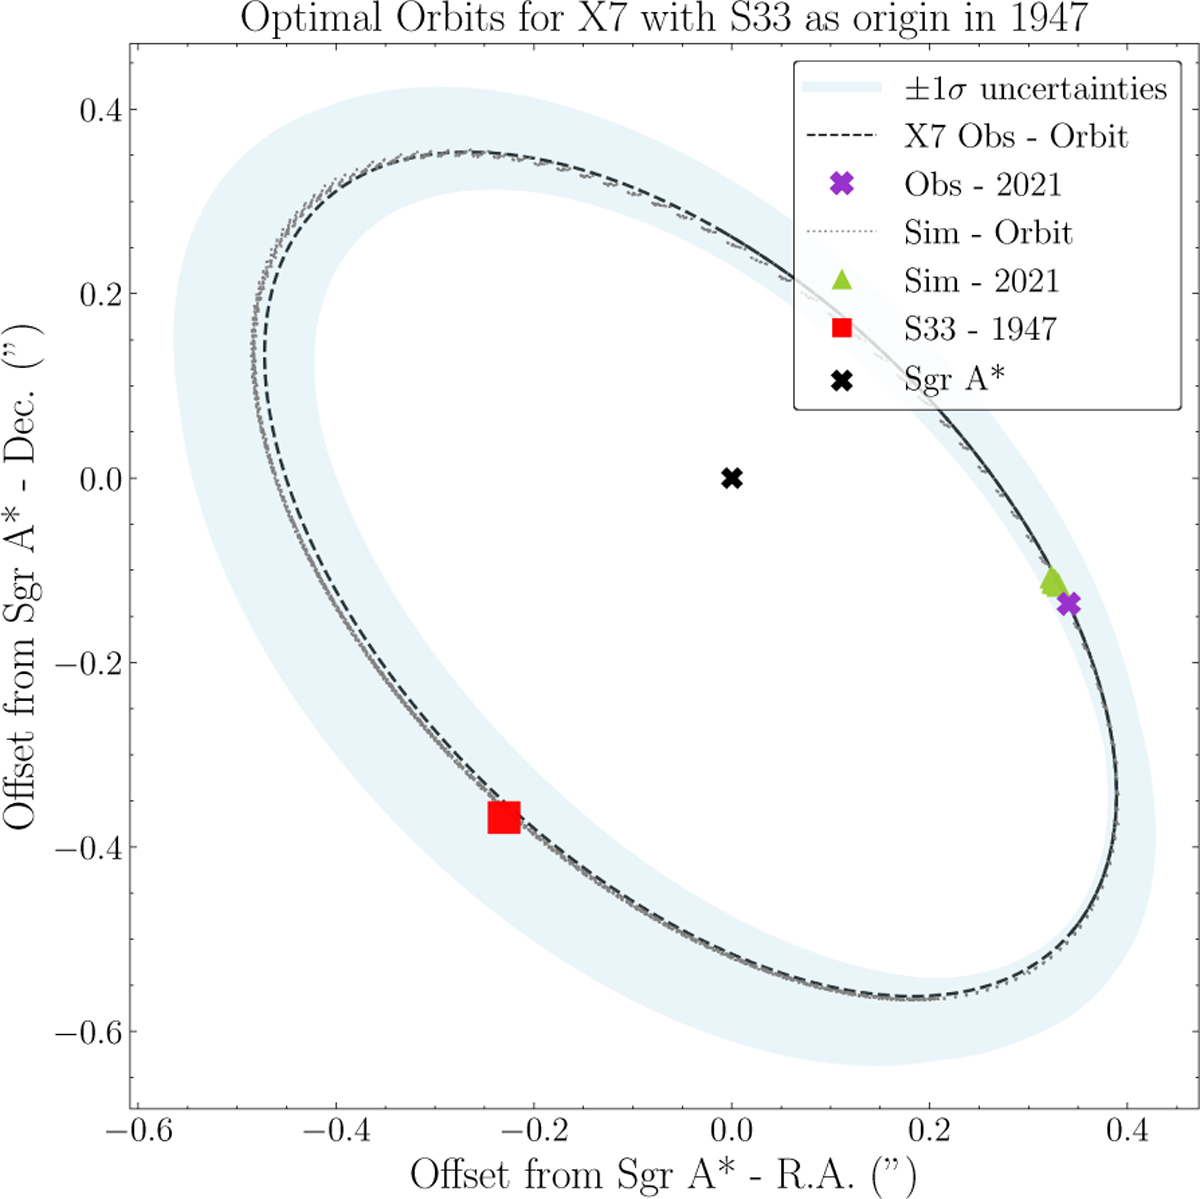
Comparison of the sky-projected orbits and position in 2021 of X7 and the tip of the simulated clouds. The dashed black line shows the best-fit orbit of the tip of X7, the light blue shaded region shows the uncertainties with a 68% confidence interval, and the purple cross marks its position in 2021 (Ciurlo et al. 2023). The dotted gray lines show the orbit of the simulated clouds for each of the optimal velocities. The red squares and light green triangles show the position of the tip of the simulated clouds in 1947 and 2021, respectively.
Current usage metrics show cumulative count of Article Views (full-text article views including HTML views, PDF and ePub downloads, according to the available data) and Abstracts Views on Vision4Press platform.
Data correspond to usage on the plateform after 2015. The current usage metrics is available 48-96 hours after online publication and is updated daily on week days.
Initial download of the metrics may take a while.