Fig. 8
Download original image
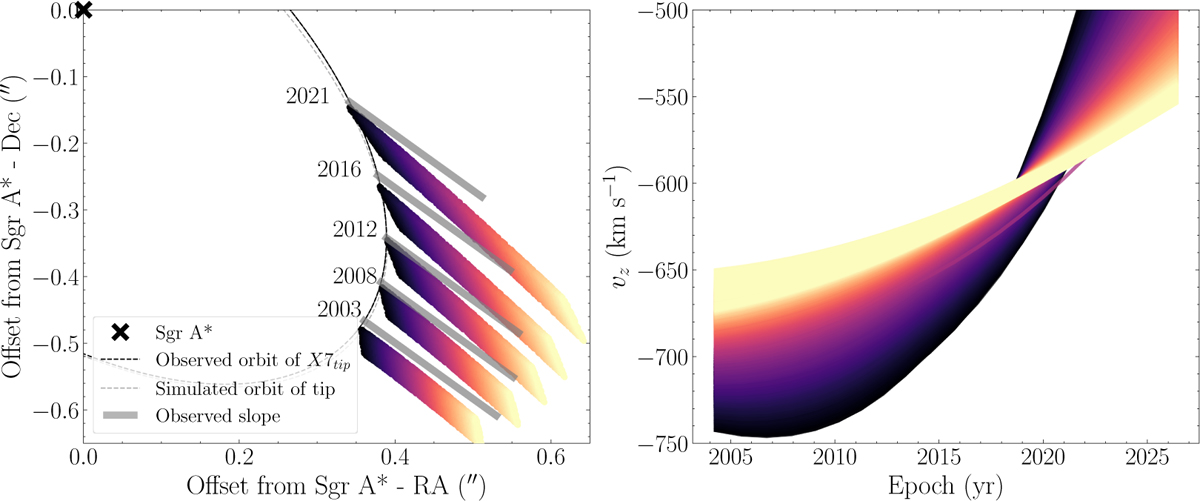
Evolution of the inclination and line-of-sight velocity for the best-fitting simulated cloud during the period of the observations. Left panel: sky projection of the simulated cloud at t = 2003, 2008, 2012, 2016, and 2021 yr. The particles are colored from tip to tail from black to yellow. The gray shaded lines show the observed slope of the ridge of X7 at the same epochs (length not to scale). Right panel: line-of-sight velocity of the particles as a function of time. The colors represent the corresponding particles shown in the left panel. This figure is analogous to Fig. 10 of Ciurlo et al. (2023).
Current usage metrics show cumulative count of Article Views (full-text article views including HTML views, PDF and ePub downloads, according to the available data) and Abstracts Views on Vision4Press platform.
Data correspond to usage on the plateform after 2015. The current usage metrics is available 48-96 hours after online publication and is updated daily on week days.
Initial download of the metrics may take a while.