Open Access
Fig. 7
Download original image
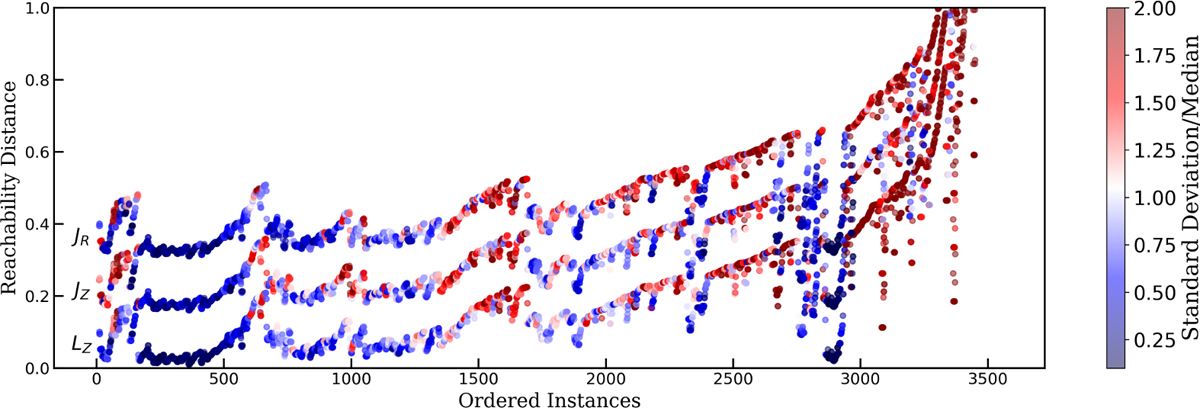
Reachability plot of the APOGEE dataset. The points are colour-coded according to the ratio between the standard deviation and the median over segments of length ten in LZ, JR and JZ. Blue (red) stars have a lower (higher) standard deviation. The three variables are plotted with a vertical offset to avoid overlapping.
Current usage metrics show cumulative count of Article Views (full-text article views including HTML views, PDF and ePub downloads, according to the available data) and Abstracts Views on Vision4Press platform.
Data correspond to usage on the plateform after 2015. The current usage metrics is available 48-96 hours after online publication and is updated daily on week days.
Initial download of the metrics may take a while.