Fig. 9
Download original image
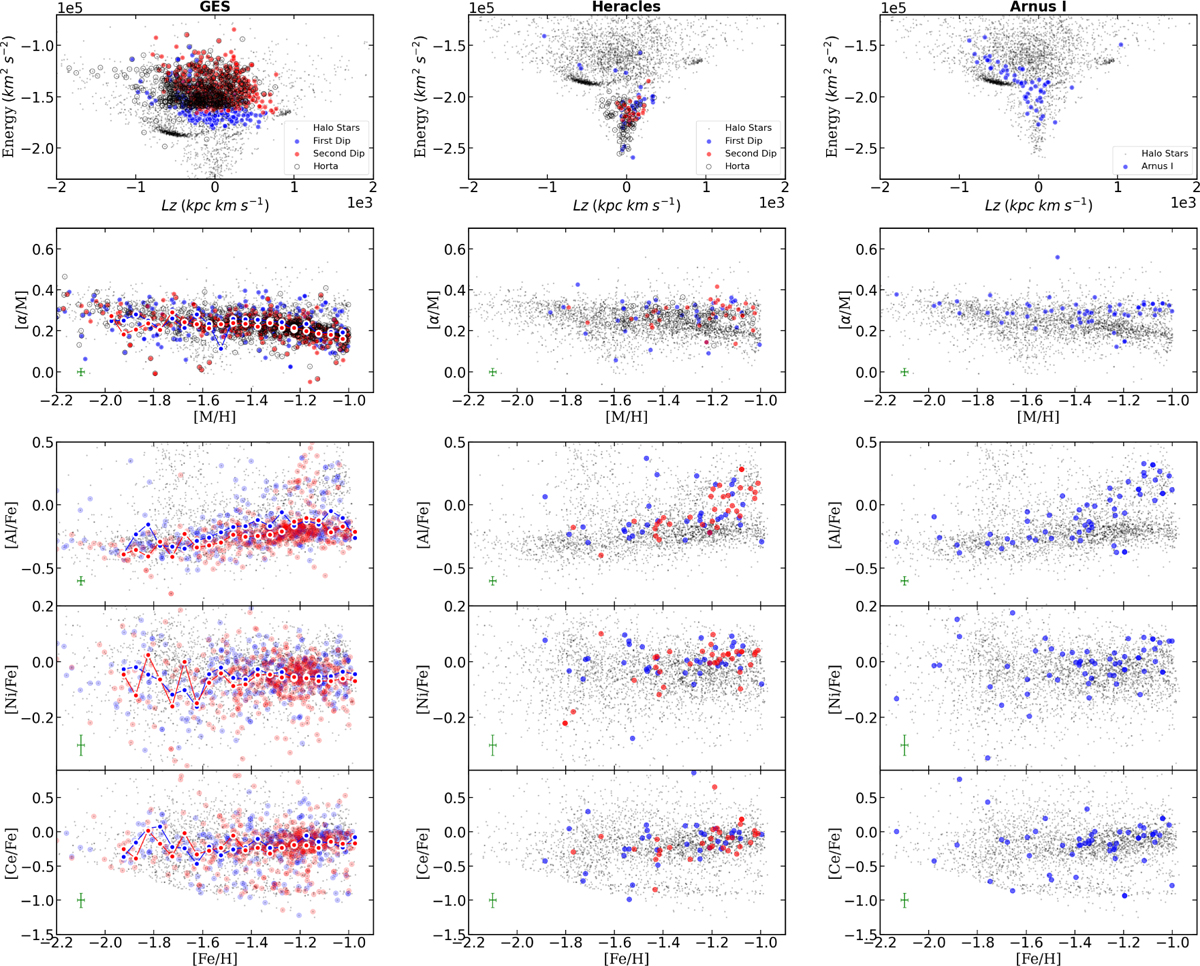
First column: Lindblad diagram, [α/M] versus [M/H], and abundance ratios of Al, Ni, and Ce over Fe as a function of [Fe/H] for stars in GES. The halo sample is represented with grey dots, the GES first dip population is shown with semi-transparent blue circles, and the second dip is in red. Mean abundance of the α-elements, [Al/Fe], [Ni/Fe], and [Ce/Fe] of the first and the second dip of GES are shown with blue and red circles, connected by continuous lines. The green crosses represent the mean error on the element. Second Column: the same plots are repeated for the Heracles stream. The halo sample is represented with grey dots, the Heracles first dip population with semi-transparent blue circles and the second dip in red. Third column: the same plots are repeated for the Arnus I stream. The halo sample is represented with grey dots, the Arnus I population with semi-transparent blue circles.
Current usage metrics show cumulative count of Article Views (full-text article views including HTML views, PDF and ePub downloads, according to the available data) and Abstracts Views on Vision4Press platform.
Data correspond to usage on the plateform after 2015. The current usage metrics is available 48-96 hours after online publication and is updated daily on week days.
Initial download of the metrics may take a while.