Fig. 1.
Download original image
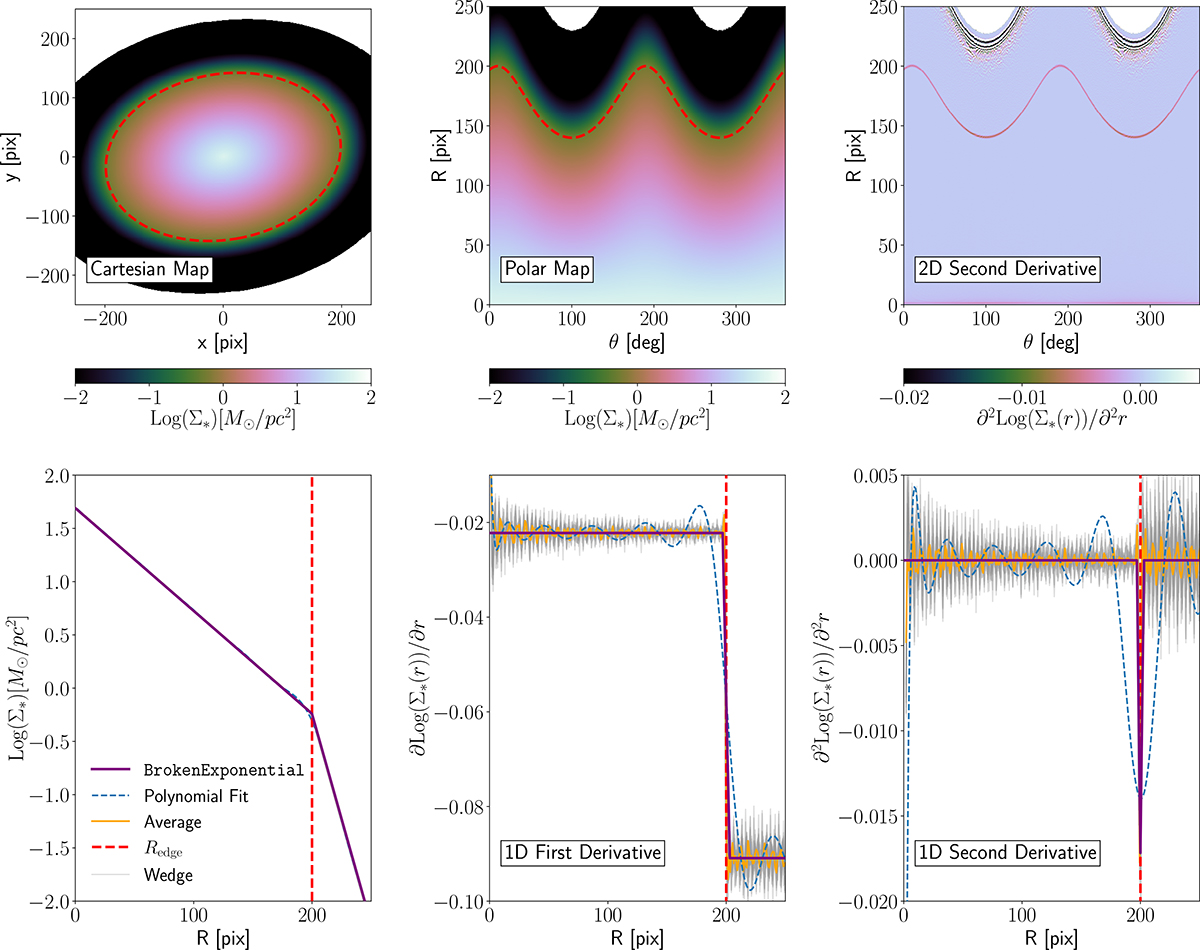
Edge detection method. The figure presents the stellar mass density map in Cartesian and polar coordinates (top left and top central panels), and the averaged surface stellar mass density profile (bottom left panel) of a simulated disk, computed in three different cases as is explained in the main text. The first derivative of the stellar mass density profile (bottom central panel) and the second derivative in both 2D (upper right) and 1D (bottom right) are also shown. Gray lines represent the surface stellar mass density and its derivatives using 10° wedges along azimuthal angles. Dashed red lines indicate Redge, corresponding to the minimum of the second derivative.
Current usage metrics show cumulative count of Article Views (full-text article views including HTML views, PDF and ePub downloads, according to the available data) and Abstracts Views on Vision4Press platform.
Data correspond to usage on the plateform after 2015. The current usage metrics is available 48-96 hours after online publication and is updated daily on week days.
Initial download of the metrics may take a while.