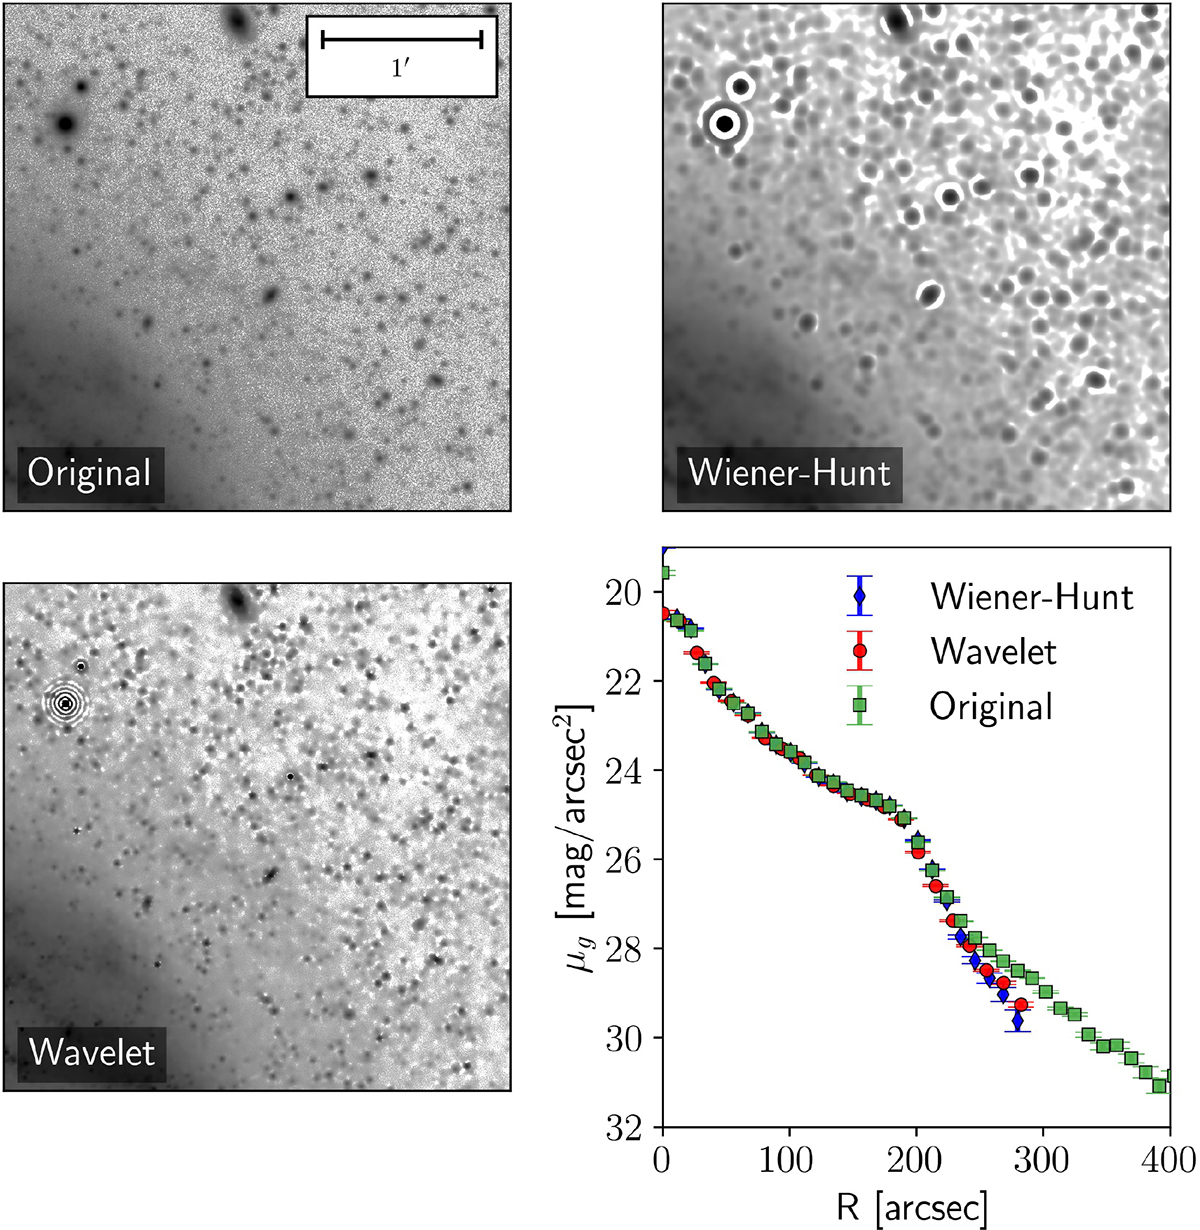
Fig. F.2.
Download original image
Effect of different deconvolution methods on the background of LIGHTS data. Gray-scaled images correspond to the g band. The bottom right panel shows the averaged surface brightness profile of NGC 3486 after applying Wiener-Hunt (blue) and wavelet-regularized (red) deconvolution techniques, compared to the original profile (green).
Current usage metrics show cumulative count of Article Views (full-text article views including HTML views, PDF and ePub downloads, according to the available data) and Abstracts Views on Vision4Press platform.
Data correspond to usage on the plateform after 2015. The current usage metrics is available 48-96 hours after online publication and is updated daily on week days.
Initial download of the metrics may take a while.